How to Access the Serial Console in HI802 / GK802 mini PC

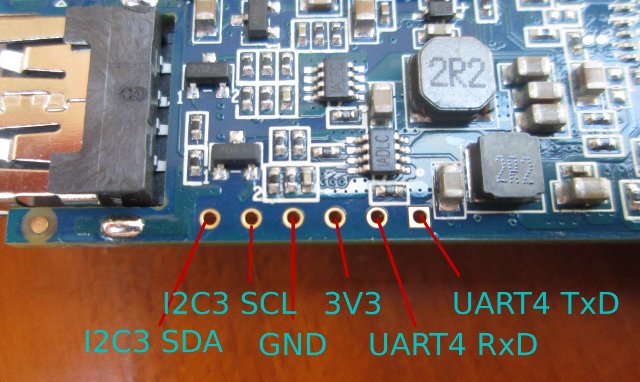
One of the advantage of HiAPad Hi802 (aka Zealz GK802) is that it provides access to UART and I2C pins via through holes on the board. UART4 Tx and Rx pins give you access to the serial console which is a must for bootloader (U-boot), and kernel development or for debugging. The first thing is the open the casing and locate the debug pins on the board. The very best way is probably to solder a pin header, but since I don’t have header, nor soldering iron, I’ve done it the “MacGyver” way with 3 wires connected to TxD, RxD and GND, and some sticky tape. You can now insert the other side of the wires into your USB to TLL debug board (GND <-> GND, Tx <-> Rx, and Rx <-> Tx), and connect it to your Windows or Linux PC. The serial board should be recognized as a […]

Debugging Embedded Linux (Kernel) Power Management – ELCE 2012

Tero Kristo, Linux kernel developer at Texas Instruments, explains how to debug power management in Embedded Linux at ELCE 2012. Abstract: The presentation will talk about debugging various problems a kernel developer can face when working with power management. These include hardware related issues (IC / HW layout bugs, bad documentation) and software related (kernel bugs, driver problems, adding new kernel features, bad userspace behavior.) Along with presenting some of these problems, I will discuss about ways to debug these… power management typically requires specific tools to be used. I will base the discussion on my first hand experience from working with Linux PM. Target audience is (kernel) software developers interested in power management. The presentation is divided into 3 sections: Debugging tools / methods for PM Disabling kernel features Stress testing Tracing (printk / low level UART) GPIO / LED trace Debugger Buffered traces / statistics with trace-cmd & […]

BoFs: Developer Tools and Methods: Tips & Tricks – ELCE 2012

Tim Bird, senior staff software engineer at Sony Network Entertainment, hosts a BoF session about tools & methods for embedded Linux developers at ELCE 2012. Abstract: In this Birds-of-a-Feather-session, Tim will share some of his favorite tips for developing embedded Linux software. This will include tips for using ‘git’, how he does multi-platform development, and tips for other tools that other developers might find useful. Prior to the event, Tim will do a survey and solicit ideas from other developers as well. Please come to this BoF prepared to share your own productivity tips for embedded Linux development. Tim talks is divided into the following key points: Git tips – How to finds info about commits (git log, git show), use aliases (e.g. for colored output), find a commit that caused problem (git bisect), and more Patch management – quilt patch managing tool, diffinfo, and splitpatch (to break patches apart) […]

USB Debugging and Profiling Techniques – ELCE 2012

Kishon Vijay Abraham and Basak Partha, respectively software design engineer and tech lead at Texas Instruments, provide an overview of techniques that can be used to debug Linux USB drivers on the host PC or/and the device itself. Abstract: The widespread integration of USB into embedded applications presents many developers with the challenge of debugging problems, that are difficult to detect and isolate when a USB device misbehaves. This paper discusses about the various USB debugging techniques which includes debugging at the host PC, at the device and in the cable and discuss when each of the above techniques will be handy. This paper will also discuss about the various facilities provided within Linux kernel to aid in USB debugging e.g sysfs, trace points etc. and the various user space tools available to help USB debugging e.g USBMON. This paper also discusses about the profiling techniques at various levels in […]

OpenOCD: Hardware Debugging and More – ELCE 2012

Peter Stuge, self-employed hardware, software and security consultant, talks about OpenOCD open source tool for JTAG debugging at ELCE 2012 in Barcelona. Abstract: The presentation walks through how to use the OpenOCD open source software to debug embedded systems on the hardware level via JTAG interface, allowing single stepping, setting breakpoints, inspecting register and memory contents and more, starting before the CPU even executes the first instruction. After an introduction to JTAG debugging we look at how to use OpenOCD both standalone for firmware flashing as well as together with the GDB GNU Debugger for convenient debugging of bootloaders or the Linux kernel. These tasks will be demonstrated, and the respective OpenOCD configuration details will be explained.The presentation targets intermediate-level developers who work on bootloaders, BSPs and kernel drivers, deeply embedded systems, and test and production engineers with an interest in using OpenOCD, which can allow unified tooling across all […]

LinuxCon North America 2012 Schedule

LinuxCon (North America) 2012 will take place on August 29 – 31, 2012 at Sheraton Hotel & Marina, in San Diego, California. The event will be co-located with the Linux Kernel Summit, the Linux Plumbers Conference, and CloudOpen 2012. LinuxCon consists of 3 days of keynotes, business and developers related sessions as well as tutorials. There will be over 80 sessions and keynotes during those 3 days. I’ll highlight a few sessions that I find particularly interesting and related to embedded Linux, software development and ARM. August 29 10:45 – 11:30 – Life After BerkeleyDB: OpenLDAP’s Memory-Mapped Database by Howard Chu, Symas Abstract: OpenLDAP’s new MDB library is a highly optimized B+tree implementation that is orders of magnitude faster and more efficient than everything else in the software world. Reads scale perfectly linearly across arbitrarily many CPUs with no bottlenecks, and data is returned with zero memcpy’s. Writes are on […]

Quick Binary Debugging in Linux with Strace System Call Tracer

I’ve recently come across strace, a debugging utility for Linux that “monitor the system calls used by a program and all the signals”. It may not be that useful if you have the source code and can run other debugging tools such as gdb, or simply add printf to your code. But if you don’t have source code of the program, or you are a system administrator who wants to check if the program fails due to file access reasons, for example, this is really a great tool as it may help you find out which file causes problem. In my case, I was trying OpenGL ES on an ARM platform, and at least part of the code comes in libraries that are only available in binary form. I got the following error message running es2_info (part of mesa-utils-extra): UMP: ump_arch_open() failed to open UMP device driver ********************************************************************* ERROR: In […]

Ubuntu, Tizen, XMBC… Demos at Q2.12 Linaro Connect in Hong Kong

Linaro has announced several demos would take place at Linaro Connect on June 1st, 2012 in Hong Kong: Big.LITTLE in-kernel Switcher (Linaro) SIProp – Combat Scouter – How much your Combat Power? (SIProp) Android Toolchain Improvements (Linaro) Origen Running Awesome Code (Linaro) Snowball with MM enablement (Linaro) Tizen on Snowball (Linaro) Google+ Hangouts on an ARM Board (Linaro) Low-Cost Logic Analyzer (Linaro) XBMC on Snowball – ST Ericsson Snowball (Linaro) (Ubuntu) Unity 3D on Snowball (Linaro) Ubuntu TV on Snowball (Linaro) PCM (Phase Change Memory) : Linaro kernel meets with the PCM technology (Micron) ARM DS-5 & Linaro (ARM) Most of the demos will be organized by Linaro, but three others companies will also shown the “show”, namely SIProp, Micron and ARM. It’s always interested to see what happens at Linaro because it gives a view into the future to what may comes to the new products and developers can see what new features are available for […]