Raspberry Pi Debug Probe eases bare metal development for $12

Raspberry Pi Debug Probe

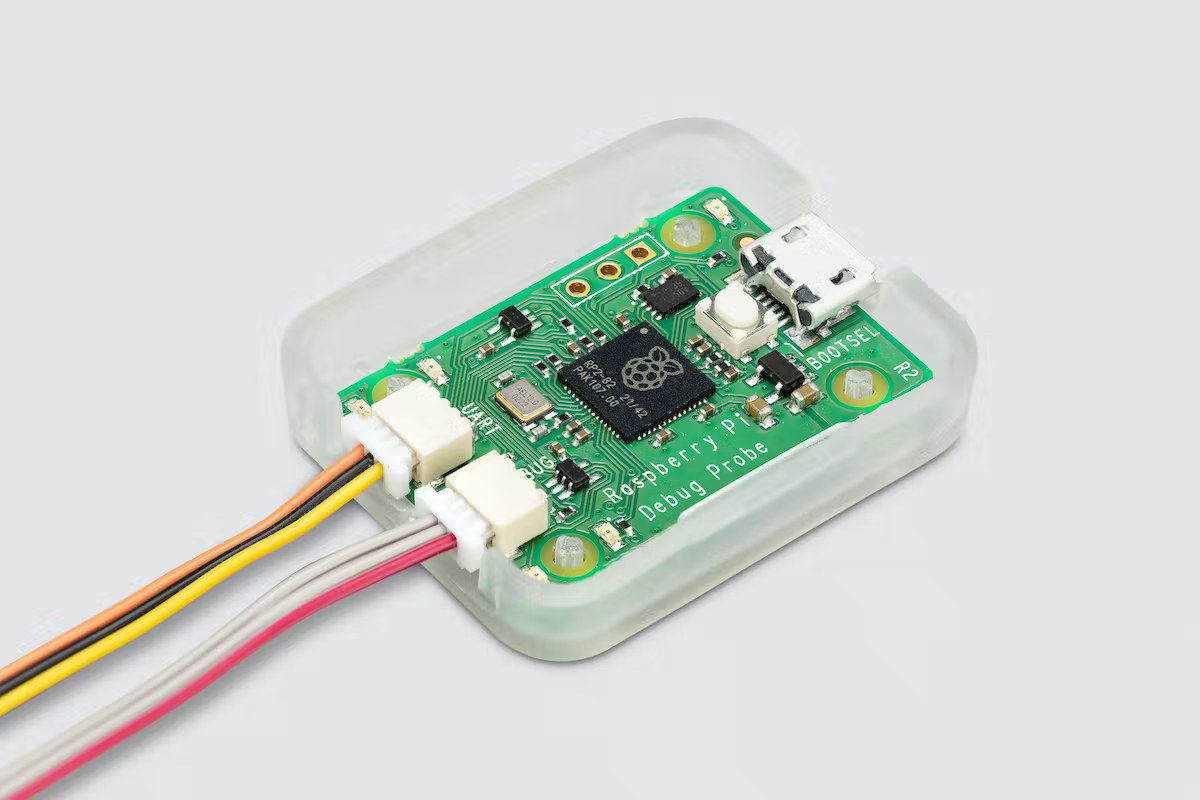
The Raspberry Pi Debug Probe is a USB serial adapter based on the Raspberry Pi RP2040 microcontroller and designed to debug the Raspberry Pi Pico, third-party RP2040 boards, and pretty much any Arm board through SWD and/or UART interfaces. The main advantage over a typical USB-to-serial adapter is the presence of a Serial Wire Debug (SWD) bridge used for bare metal code development and debugging through tools such as OpenOCD. The Raspberry Pi Debug Probe specifications: MCU – Raspberry Pi RP2040 dual-core Cortex-M0+ microcontroller @ 133 MHz with 264KB SRAM Storage – 2MB SPI flash (W25Q16JVUXIQ) Debug interfaces 3.3V Serial Wire Debug (SWD) 3-pin JST connector conforming to the Raspberry Pi Debug Connector Specification and compatible with the CMSIS-DAP standard 3.3V serial (UART) 3-pin JST connector USB – Micro USB port to connect to the host Misc BOOTSEL button for flashing firmware to the debug board Unpopulated 3-pin header with […]

OpenOCD: Hardware Debugging and More – ELCE 2012

Peter Stuge, self-employed hardware, software and security consultant, talks about OpenOCD open source tool for JTAG debugging at ELCE 2012 in Barcelona. Abstract: The presentation walks through how to use the OpenOCD open source software to debug embedded systems on the hardware level via JTAG interface, allowing single stepping, setting breakpoints, inspecting register and memory contents and more, starting before the CPU even executes the first instruction. After an introduction to JTAG debugging we look at how to use OpenOCD both standalone for firmware flashing as well as together with the GDB GNU Debugger for convenient debugging of bootloaders or the Linux kernel. These tasks will be demonstrated, and the respective OpenOCD configuration details will be explained.The presentation targets intermediate-level developers who work on bootloaders, BSPs and kernel drivers, deeply embedded systems, and test and production engineers with an interest in using OpenOCD, which can allow unified tooling across all […]

LinuxCon North America 2012 Schedule

LinuxCon (North America) 2012 will take place on August 29 – 31, 2012 at Sheraton Hotel & Marina, in San Diego, California. The event will be co-located with the Linux Kernel Summit, the Linux Plumbers Conference, and CloudOpen 2012. LinuxCon consists of 3 days of keynotes, business and developers related sessions as well as tutorials. There will be over 80 sessions and keynotes during those 3 days. I’ll highlight a few sessions that I find particularly interesting and related to embedded Linux, software development and ARM. August 29 10:45 – 11:30 – Life After BerkeleyDB: OpenLDAP’s Memory-Mapped Database by Howard Chu, Symas Abstract: OpenLDAP’s new MDB library is a highly optimized B+tree implementation that is orders of magnitude faster and more efficient than everything else in the software world. Reads scale perfectly linearly across arbitrarily many CPUs with no bottlenecks, and data is returned with zero memcpy’s. Writes are on […]

Debugging Embedded Linux with GDBserver and Insight (gdb GUI)

Although it it sometimes possible to debug applications using GDB (The GNU Debugger) on the target boards, there is often not enough memory available to run GDB on embedded systems running Linux. To work around this issue, you can use gdbserver to perform remote debugging. Installing and running gdbserver on the target board First of all you need to install gdbserver on the target board. Assuming you use a Debian based distribution:

If you distribution, does not have binary repository, you can download gdb source code and cross-compile gdbserver. Once gdbserver is installed, (cross-)compile your application in debug mode and start gdbserver as follows:

Where target_ip and target_port are respectively the IP address of the board and the chosen TCP port, and prog_dbg, the program under test compile in debug mode (CFLAGS=-g). Remote Debugging with GDB If you are familiar with gdb and prefer to use the command […]

Linux Kernel Debugging – Linaro Connect Q4 2011

Linaro Connect Q4.2011 takes place on the 31 October – 4 November 2011 in Orlando. In the video below, Linaro toolchain developers asked kernel developers about their potential needs for kernel debugging. Several options to improve the kernel debugging experience were discussed. In particular, the toolchain group will make sure that OpenOCD works at least on one of the member boards to allow for easy debugging through JTAG. They also mentioned support for o-profile. This session was an opportunity to review debugging techniques used by kernel developers. It also allowed most participants to discover the GDB Text User Interface (GDB TUI), a very convenient way to interact with GDB, without having to go through heavyweight environments like Eclipse. You can follow this subject on Blueprints for Toolchain support for Kernel Debugging on Linaro website. The audio is quite poor, so use some headphones or boost the volume to hear anything. […]