IAR Systems I-jet Hardware Debugging Probe Is Now Available

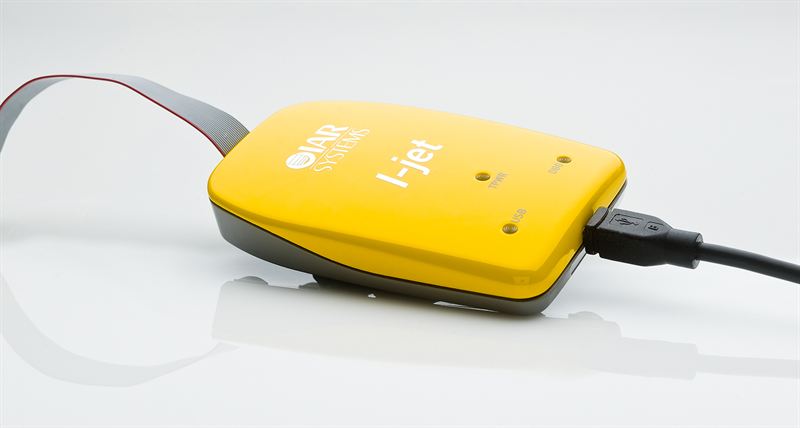
IAR Systems has announced the availability of I-jet, a new in-circuit debugging probe that can be used in conjunction with Embedded Workbench for ARM, IAR C/C++ compiler and debugger tool suite. I-jet provides download speeds of up to 1 MB per second, JTAG and Serial Wire Debug (SWD) clocking at up to 32 MHz (no limit on the MCU clock speed), and Serial Wire Output (SWO) frequencies of up to 60 MHz. I-jet probe is powered by USB and can also power the target board (Up to 400mA) and measure the power consumption accuratly (200 uA @ 200khz). The probe is plug-and-play, and supports automatic core recognition, and direct download into the flash memory. I-Jet supports ARM7, ARM9, ARM11, ARM Cortex-M, ARM Cortex-R4, and ARM Cortex-A5/A8/A9 cores. Serial Wire Viewer (SWV), Embedded Trace Buffer (ETB) and JTAG adaptive clocking are supported and all JTAG signals can be monitored. The probe […]

VWorks VLAB Powers Freescale Vybrid Virtual Platform

Back in March, Freescale announced their Vybrid solution featuring both a Cortex A5 processor and a Cortex M4 microcontroller, and they had prototypes running  an unnamed virtual platform in order to speed up software development and possibly have the software ready at the same time as the silicon is. Always looking to learn more, I studied and wrote about virtual hardware platforms such as Cadence Virtual System Platform, Wind River Simics Virtual  Platforms and the open source Imperas OVPsim simulator. It turns out Freescale does not use any of these solutions, but relies on VWorks VLAB instead, which still use the same standard (SystemC/TLM) as the virtual hardware solutions aforementioned. VWorks uploaded a demonstration of VLAB running a virtual platform for the Freescale Vybrid controller and showing how it can handle both ARM Cortex-A5 and Cortex-M4 cores. This demo of VLAB 1.7.0 is pretty interesting and showcases: Dual (virtual) display […]

ARM Development Studio 5 (DS 5) Demos At Design West

ARM has shot a few video demos of their ARM Development Studio 5 (DS 5), a software development tool suite for ARM platforms, at Design West 2012. The first video shows DS 5 running on the Xilinx Zynq-7000 platform (dual cortex A9 + FPGA), and we can see the memory map, registers, call graphs and stack usage. We can also see real-time processor switching and the function that takes the most CPU resources (profiling). The second videos showcases ARM DS-5 Streamline, a performance analyzer, which helps determine how well programs are running on a Linux or Android platform, on an Samsung Exynos 4210 platform (Origen board?). This tool also to profile both the dual-core ARM Cortex-A9 and ARM Mali-400 MP GPU in the platform. We are shown three types of reports: CPU/GPU Loading Threads usage Power Usage per application The third and last video shows ARM DS 5 on Freescale i.MX6 […]

ADB: (Android Debug Bridge) : How It Works – Android Builder Summit 2012

Tetsuyuki Kobayashi, working at Kyoto Microcomputer a Japanese development tool vendor, explains how the ADB (Android Debug Bridge) works at Android Builder Summit in February 2012. Abstract: ADB is very nice and important tool. Every Android Builders uses adb command such as ‘adb shell’ and ‘adb logcat’. But what does it mean ‘adb kill-server’ ? I studied the source code of adb. I share you how adb works and some tips I found. This session is for developers who want to know Android internal deeply. You can also download the presentation slides on linuxfoundation.org website. Jean-Luc Aufranc (CNXSoft)Jean-Luc started CNX Software in 2010 as a part-time endeavor, before quitting his job as a software engineering manager, and starting to write daily news, and reviews full time later in 2011. www.cnx-software.com

Linux Debugging: Listing Shared Libraries at Runtime

I had a library (a python plugin) that crashed and outputted the “very useful”: illegal instruction I tried pdb (the Python Debugger) to find the issue without success. So I tried to add some printf to this library but none were outputted at runtime.  So I guessed the illegal instructions was generated by the shared libraries. Let’s see how many libraries we’ve got: ldd libbrowsernode.so | wc -l 125 Oh dear!… 125 libraries.. This is where panic sets in. Luckily, there is a simple way to list the dynamic libraries as they are loaded (and some more useful info). Simply set: export LD_DEBUG=files before running your program. This is extremely verbose, so I recommend you redirect the output to a file. This method allowed me to find undefined symbols during dynamic libraries load time with errors such as: opening file=/usr/lib/gtk-2.0/2.10.0/loaders/libpixbufloader-png.so [0]; direct_opencount=1 14121: 14121:     /usr/lib/gtk-2.0/2.10.0/loaders/libpixbufloader-png.so: error: symbol lookup error: undefined […]

Linux Kernel Debugging – Linaro Connect Q4 2011

Linaro Connect Q4.2011 takes place on the 31 October – 4 November 2011 in Orlando. In the video below, Linaro toolchain developers asked kernel developers about their potential needs for kernel debugging. Several options to improve the kernel debugging experience were discussed. In particular, the toolchain group will make sure that OpenOCD works at least on one of the member boards to allow for easy debugging through JTAG. They also mentioned support for o-profile. This session was an opportunity to review debugging techniques used by kernel developers. It also allowed most participants to discover the GDB Text User Interface (GDB TUI), a very convenient way to interact with GDB, without having to go through heavyweight environments like Eclipse. You can follow this subject on Blueprints for Toolchain support for Kernel Debugging on Linaro website. The audio is quite poor, so use some headphones or boost the volume to hear anything. […]

Android Debugging on MIPS Platform with Viosoft Arriba Debugger

I’ve recently attended a webinar organized by EETIMES with MIPS and Viosoft entitled “Android Platform: It’s Not Just For Handsets Anymore” on the 26th October 2010. You can now register for the on demand version at http://seminar2.techonline.com/s/mips_oct0610 The purpose of this web conference was to explain the status of Android for Set-top-box and MID development, the complexity of debugging kernel, java and application in an Android system as well as showcasing Viosoft Arriba to debug Android on MIPS. If you ever develop Android on Sigma Designs SMP864x/SMP865x platforms you’ll probably use Viosoft Arriba. You may refer to the following material Comprehensive Development and Debug Coverage for Linux and Android on the MIPS Architecture that contains the slides used during the presentation. Rick Leatherman – Vice President, Development Tools at MIPS Technologies, Inc – firstly described Android architecture with the application level, Library/Android (Dalvik), and the kernel. He then explained the […]