
Imagination Technologies has some advanced tools such as PowerVRTune in their Powervr Graphics SDK, but they’ve now released a simple tool called PVRMonitor to display real-time CPU and GPU usage for Android devices featuring PowerVR GPUs. In some firmware, Android’s Developer Settings have options to enable CPU and GPU usage, but in my phone for example, this is not available, so this app may be handy to check whether your system or app is taking too many resources.
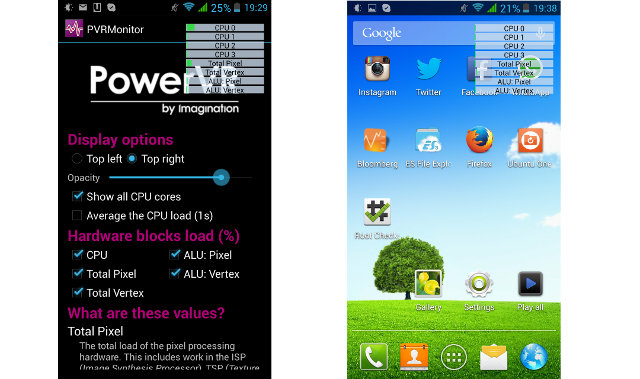 Inside the application, you can select the overlay position, whether to show all CPU cores with CPU load averaged over 200ms, or over one second. You can select five hardware blocks to display:
- CPU
- Total Pixel – Load in percent of the pixel processing hardware including texturing, raster operation and fragment shader processing. If nothing is modified on the screen it should be zero, and if it is too high during games for example, the game code may need to be optimized.
- Total Vertex – Load in percent of the vertex processing hardware including vertex processing in the ALUs, work in the Tile Accelerator and related stall time.
- ALU: Pixel – Percentage of time that the ALUs have spent processing pixel shaders.
- ALU: Vertex – Percentage of time that the ALUs have spent processing vertex shaders.
PVRMonitor will display an overlay on top of Android showing CPU and GPU usage, and in the home screen, everything should be close to zero after a few seconds. CPU0 may have small bursts due to CPU usage, and if you scroll the screen you’ll see Total Pixel go around 50%.
I’ve run Antutu for fun, and to see what happens for different tasks.
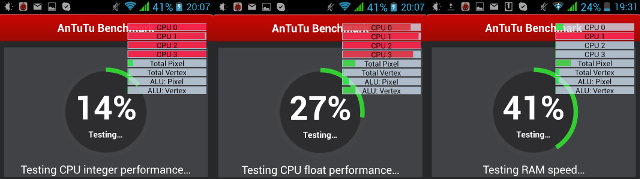 Integer and float performance tests take all 4 CPUs on Mediatek MT6589T, and just one or two CPUs for RAM speed test. Total Pixel is up a bit because Antutu updates its interface, but I have no idea why “ALU: Vertex” is registering anything during these CPU/RAM tests.
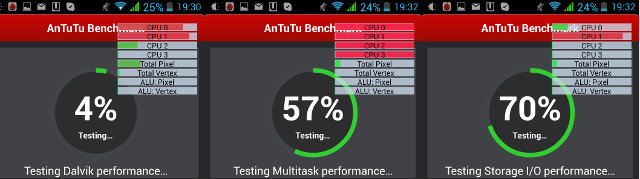 The Dalvik test only seems able to use 2 cores, Multitask performance test use 3 to 4 CPUs but they are not all at 100% all the time, and IO is mostly using one CPU core.
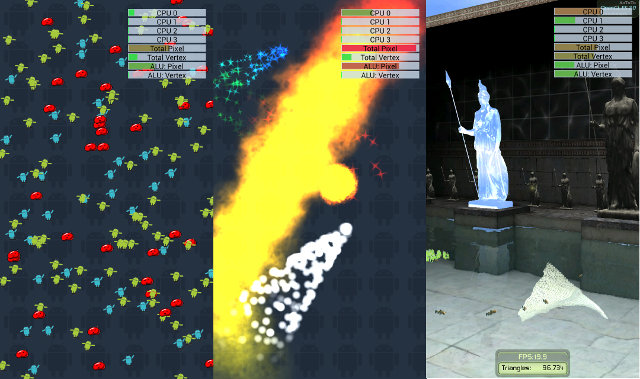 Both 2D graphics tests are boosting Total Pixel and ALU: Pixel values as expect, with the second test being more demanding. CPU cores take it easy during these tests as the GPU handles most of the tasks. The 3D also acts as expected with both Vertex and Pixel bars moving higher, and the CPU usage is most of the time handles by one, and sometimes two cores. I’ve also tried an actual 3D games, Subway Surfers, and it’s only using 2 CPU cores.
If for some reasons you can’t access Google Play, PVRMonitor is also available as an apk.

Jean-Luc started CNX Software in 2010 as a part-time endeavor, before quitting his job as a software engineering manager, and starting to write daily news, and reviews full time later in 2011.
Support CNX Software! Donate via cryptocurrencies, become a Patron on Patreon, or purchase goods on Amazon or Aliexpress. We also use affiliate links in articles to earn commissions if you make a purchase after clicking on those links.