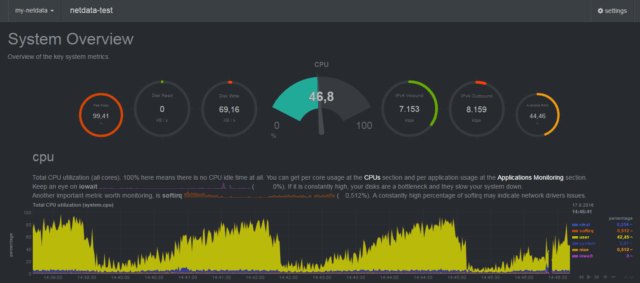
 Netdata is a real-time open source monitoring tool, that generates hundreds of metrics of performance and health monitoring parameters. Netdata is capable of visualizing this data with real-time capabilities along with alerts and notifications. This monitoring agent can be installed in all variant of Linux systems, Mac OS, FreeBSD and in Raspberry Pi .
Netdata provides options for archiving the metrics to a remote server by using TimeSeries Databases and processing engines, and can be visualized using Grafana or other tools.
Architecture Overview
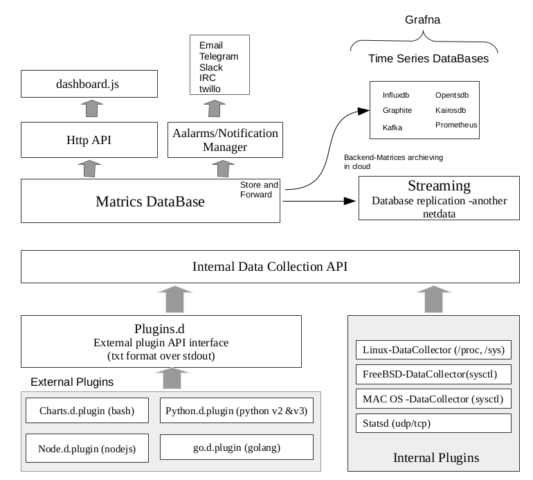
Metrics collector
- Fetches various system & health monitoring parameters (uptime, CPU load, CPU usage, RAM utilization, disk usage etc.) .
- Fetches application metrics including web servers, databases, containers, etc…
- Netdata’s Internal plugins collect most of the metrics from standard Linux system parameters such as /proc, /sys and other Linux kernel sources
- External plugins contains ready to use plugins developed by using other programing language and interfaced to Netdata daemon as stdout communication. Also allows to write custom metrics collector in BASH v4+ charts.d.plugin, node.js node.d.plugin , python v2+ (including v3) python.d.plugin. and golang (go.d.plugin)
Storage -Time Series Data-Base
Netdata is capable of collecting thousands of metrics per server per second, which would be stored in time series format. Currently Netdata supports 6 memory/storage modes:
- RAM – data will be stored in RAM using mmap()
- SAVE – This default option will store data in RAM while Netdata runs and save it into disk on daemon restart/start.
- MAP – This mode will let Netdata write data into RAM and immediately update this data into Linux Kernel. This will be working the same way that Linux Swap partition works.
- NONE – Without storage/database, collected metrics will be directly streamed to another Netdata instance.
- DBENGINE – Store data metrics into a database file as a database engine. This is the only mode supports changing the data collection update frequency without losing the previously stored metrics.
- ALLOC – Stores data in RAM using calloc().
Archiving
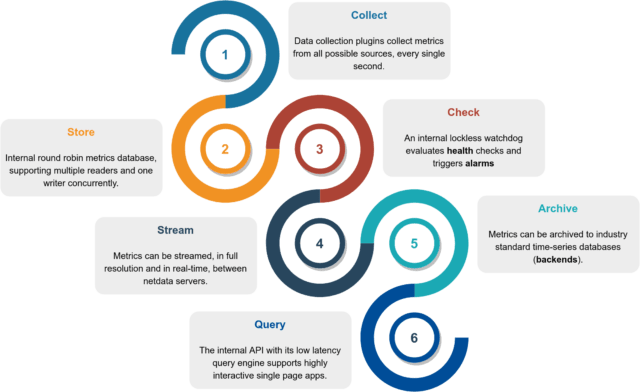 Netdata supports longtime storage archiving using external TSDB (Time series DataBase) and Processing Engines.Supports various back-ends such as –
- Graphite – Data logging and graphing tool for time series data. Using graphite, metrics can be stored in various TimeSeries Data bases – influxdb, KairosDB, Blueflood & ElasticSearch using logstash tcp input and the graphite codec.
- DocumentDb – Metrics can be send to a document db, in json format.
- MongoDB – Metrics can sent to the database in JSON format.
- Prometheus – a distributed monitoring system, which fetches and stores netdata metrics. This support been enabled from Netdata v1.7 on-wards. Refer detailed document – Using Netdata with Prometheus.
Streaming and Replication
Each Netdata node is capable of streaming metrics to another Netdata node in real-time, this helps Netdata to run headless mode and the receiver node is capable running with all Netdata features such as – DashBoard Visualisation, Setting up alarms and notifications and archive metrics to a back-end time series database.
Visualization – Web Dashboards
Netdata bundled with a GUI monitoring tool- dashboard.js, offers low latency, high resolution and user-friendly visualization tool. Have a look into the live demo, to get the feel of GUI tool. Once the installation is completed , you will be able to see the Web GUI, by opening the url – http://your.server.ip:19999/. You could also checkout some demo sites.
References

An Entrepreneur, an Opensource Enthusiast and Researcher in the domain of Embedded Systems, Wireless and IoT – Has over 16+ years of experience in managing and contributing enterprise Research Projects, in Embedded Systems, Software Technologies, Product Conceptualizations and development, Telecommunication, Media and Entertainment and Consumer Electronics.
Support CNX Software! Donate via cryptocurrencies, become a Patron on Patreon, or purchase goods on Amazon or Aliexpress




So many monitoring systems… They pop every days and they bring nothing new. Most of them are just new names using already available software blocks, like Grafana, InfuxDB and so on. So, stay with classics (Nagios, Centreon, T.I.C.K.) and dont waste your time.
Informative and concise!!