
I’m mostly a Linux user, but the marketplace has chosen Windows 10 as its preferred operating systems for mini PCs, so I’ve been reviewing fanless (or not) mini PCs running Windows 10 for around two years since Intel decided to provide low cost and low power processors. I normally run some benchmarks such as PCMark 8 or 3DMark, as well as typical user tasks, while monitoring CPU temperature and throttling using HWInfo64 utility, but those benchmarks are not really pushing the device to its limits. However, I’ve just learned out about OCCT “Overclock Checking Tool” that’s just doing that, and installed OCCT 4.4.2 on Vorke V1 to check it out.
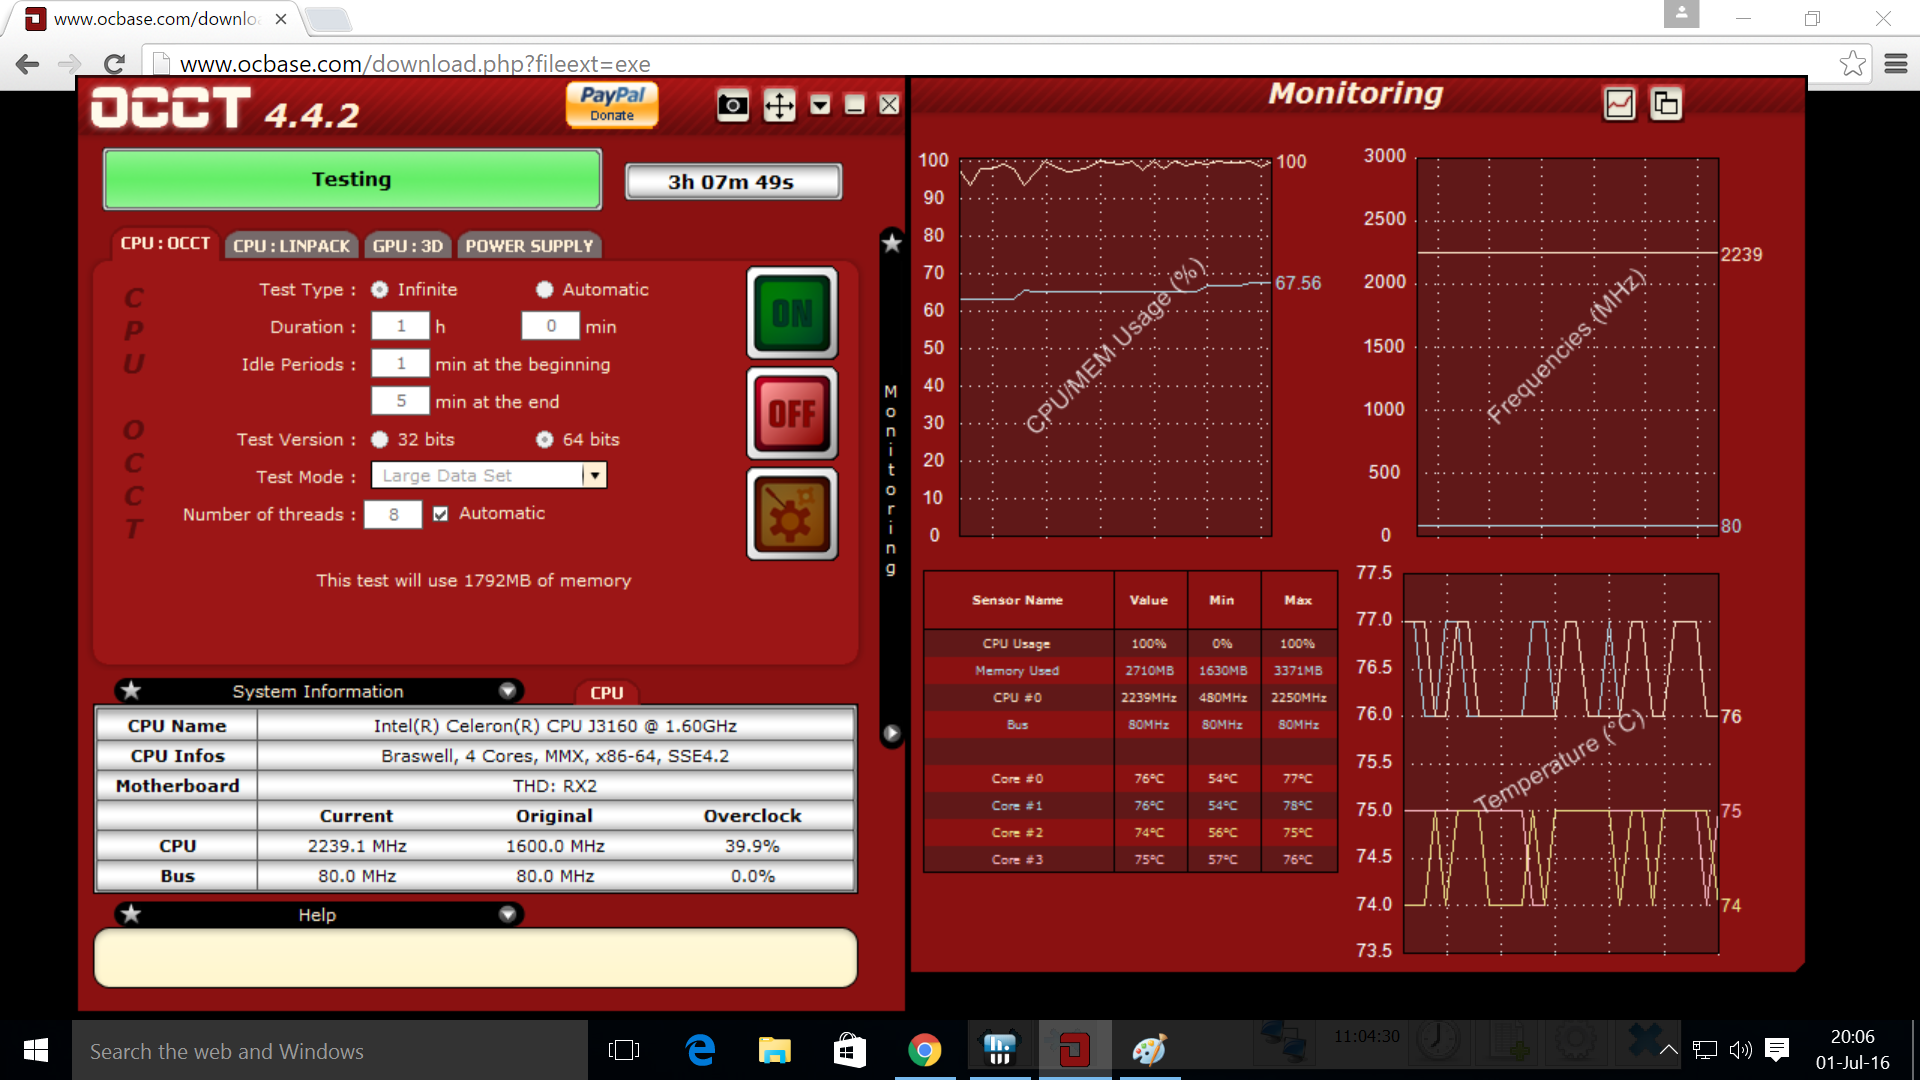
The tool has four taps: CPU: OCCT, CPU: Linpack, GPU: 3D, and Power Supply to stress test different part of the system. I just let it run for over 3 hours after pressing the ON buttons, and you can see all four cores of the Braswell processor at 100% CPU usage in turbo mode, the memory used, cores frequency, and CPU cores temperature in real-time.
I also ran HWInfo64 at the same time to double check CPU temperature and throttling, but it turns out OCCT is also generating charts for CPU usage, bus frequency, CPU #0 frequency, memory usage, and temperature for all cores. You can access the charts by clicking on the icon in the right of “Monitoring” on the right part of the screen (first screenshot). I’ve included one of the charts showing CPU usage and temperature.
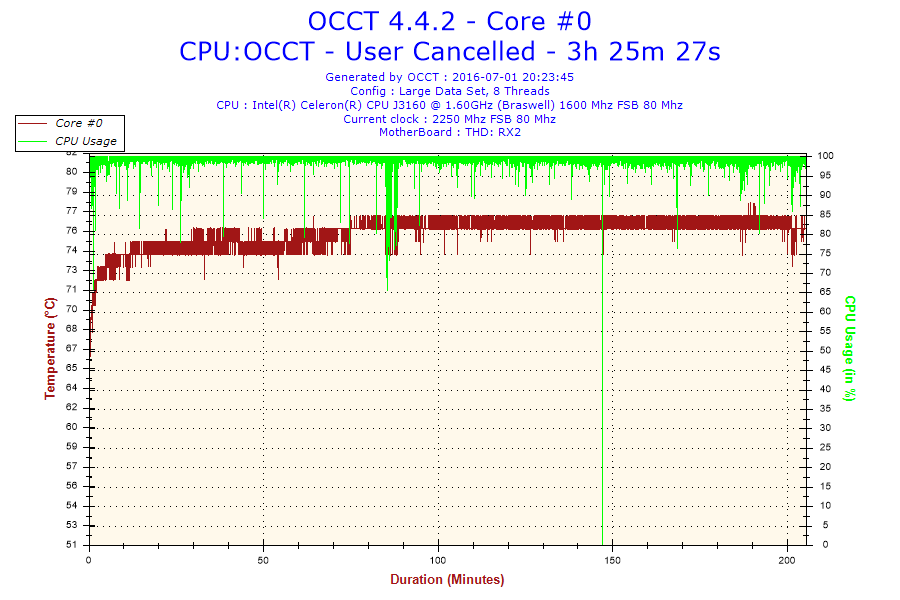
This shows Vorke V1 appears to be handling high loads very well, and does not overheat. It’s not a fanless system though, so the included fan certainly helps.
OCCT is free for personal use, and costs $150 per year for commercial use, with the commercial version also supporting custom tests, CSV output, and other features.

Jean-Luc started CNX Software in 2010 as a part-time endeavor, before quitting his job as a software engineering manager, and starting to write daily news, and reviews full time later in 2011.
Support CNX Software! Donate via cryptocurrencies, become a Patron on Patreon, or purchase goods on Amazon or Aliexpress

Am I’m missing something? But the graph only contains temperature and CPU utilization (100% can be achieved with both pretty lightweight stuff and heavy workloads) so the most important parameter — CPU clockspeed / throttling — is missing? These small Intels use the same wide cpufreq range as more recent ARM boards so without knowing actual CPU clockspeed a look at ‘CPU utilization’ is pretty useless: If throttling allows jumping between eg. 500 and 2000 MHz then a system running with 100% CPU utilization at 500 MHz is less busy than showing 26% while running at 2000 MHz. At least… Read more »
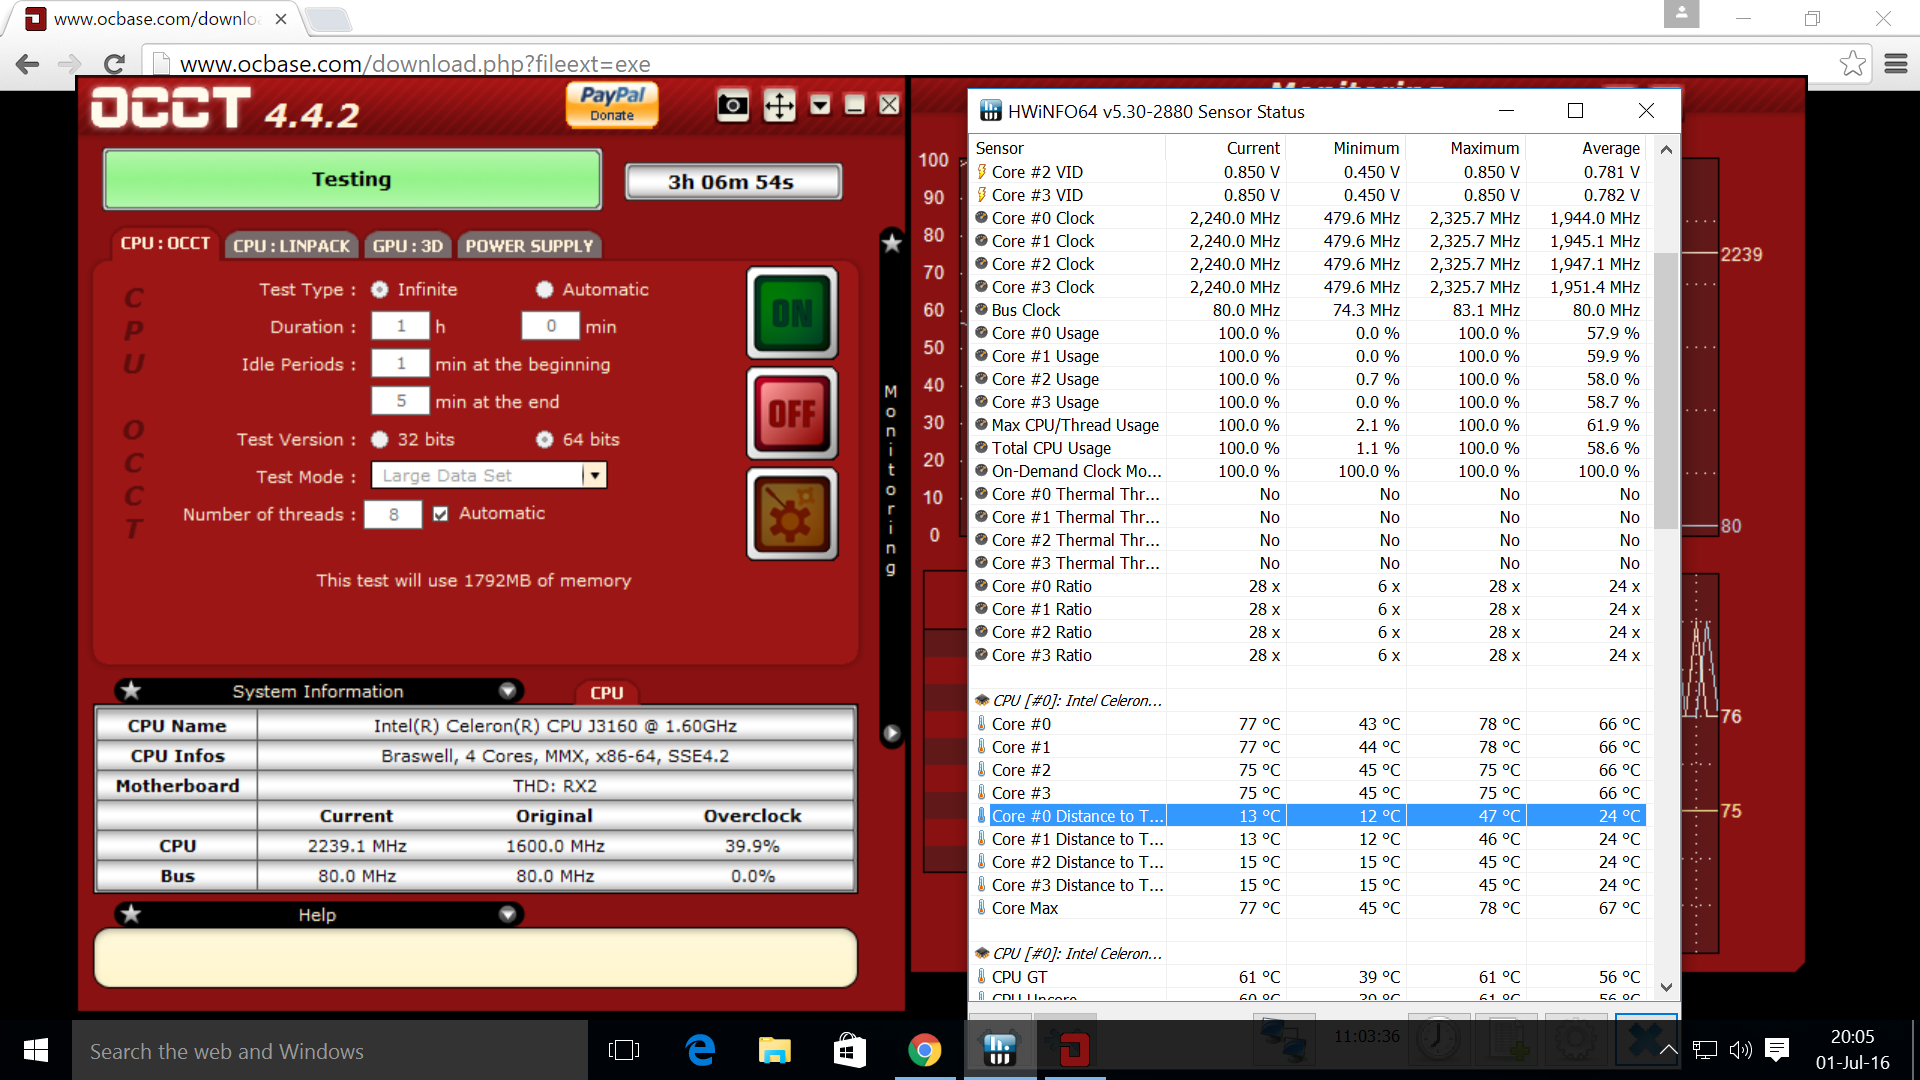
tkaiser second screenshot (hwinfo64) has info you want, it keeps track of any throttling, this screenie shows no throttling during the test
@tkaiser
OCCT generated 8 charts in total, including one with the CPU frequency showing a flat line @ 2.4 GHz, but I only included one for reference. As @rasz_pl pointed out HWInfo64 in the second chart shows whether there’s been throttling or not.
People in G+ also mentioned OCCT was not updated for a long time, and that other tools such as “cpuminer in scrypt mode and very recent prime95 produce higher temperatures on recent CPUs”.
Another windows stress test tool: http://www.aida64.com/products/aida64-extreme
@Jean-Luc Aufranc (CNXSoft) I was more talking about the usefulness of such graphs in general. If it’s known that cpufreq can switch between 480 and +2000 MHz then leaving it out is always wrong (the aforementioned example of a fan equipped device being no exception — 100% CPU utilization means nothing). Many users (even experienced ones or ‘benchmarkers for a living’) still don’t get the idea and work with useless tools like Ubuntu’s System Monitor relying on CPU utilization graphs that are 100 percent meaningless on devices that implement cpufreq scaling. We should educate users to not fool themselves all… Read more »