
Yesterday I wrote about using 3G on Raspberry Pi board, and one of the commenter mentioned higher traffic than expected when connecting to 3G to just send a few bytes before disconnecting. One of the reasons are the extra data needed if you transmit data over a secure connection, for example establishing a PPP connection, connect to the board over SSH, and disconnect, results in the transmission & reception of a few kilobytes on my board:
|
1 2 |
Connect time 1.9 minutes. Sent 5815 bytes, received 6972 bytes. |
But if you get much more traffic than that, you may want to investigate if another package may transfer data when it detects the connection is up. To analyze traffic, tcpdump and Wireshark are good options, especially if you want to look into the packets data, however such tools do not tell you which process is sending or receiving the data.
So I searched whether I could find a program that would do just that, and a thread on Ask Ubuntu discussing how to display network traffic in the terminal, mentions some interesting utilities like bmon, iftop, tcptrack, etc… which all show info about the connections, but the utility that does exactly what I I want is called nethogs. Installing it in Ubuntu/Debian is very easy.
|
1 |
sudo apt install nethogs |
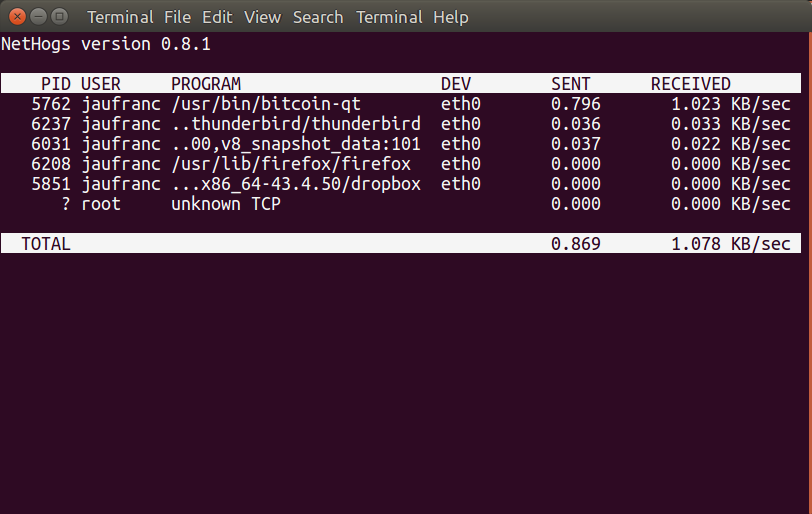
Now run it as root, as you should get a list of processes that send and received data over a specific interface:
|
1 |
sudo nethogs |
The full options can be found with -h:
|
1 2 3 4 5 6 7 8 9 10 11 12 13 14 15 16 17 18 19 20 |
nethogs -h usage: nethogs [-V] [-h] [-b] [-d seconds] [-v mode] [-c count] [-t] [-p] [-s] [ device [device [device ...]]] -V : prints version. -h : prints this help. -b : bughunt mode - implies tracemode. -d : delay for update refresh rate in seconds. default is 1. -v : view mode (0 = KB/s, 1 = total KB, 2 = total B, 3 = total MB). default is 0. -c : number of updates. default is 0 (unlimited). -t : tracemode. -p : sniff in promiscious mode (not recommended). -s : sort output by sent column. -a : monitor all devices, even loopback/stopped ones. device : device(s) to monitor. default is all interfaces up and running excluding loopback When nethogs is running, press: q: quit s: sort by SENT traffic r: sort by RECEIVE traffic m: switch between total (KB, B, MB) and KB/s mode |

Jean-Luc started CNX Software in 2010 as a part-time endeavor, before quitting his job as a software engineering manager, and starting to write daily news, and reviews full time later in 2011.
Support CNX Software! Donate via cryptocurrencies, become a Patron on Patreon, or purchase goods on Amazon or Aliexpress. We also use affiliate links in articles to earn commissions if you make a purchase after clicking on those links.


Thank you for posting this mini HowTo. Running the utility told me that the actual short text message took about 300 bytes. As you need PPP running, the data cost to bring the connection up is not displayed.
That appears to the major portion of the 10K total.
Cheers,
davef
Tried this in a VM.
If I do a ping in another shell, this ping does not show up. If I start firefix it indeed shows.
Might be this tool only works for TCP traffic.
My version is also reported as0.8.1. This is the version on the ubuntu 16.04.03 feed.
It is different than the one from CNXSoft though. The help for my version has no -a option:
usage: nethogs [-V] [-b] [-d seconds] [-v mode] [-c count] [-t] [-p] [-s] [device [device [device …]]]
-V : prints version.
-b : bughunt mode – implies tracemode.
-d : delay for update refresh rate in seconds. default is 1.
-v : view mode (0 = KB/s, 1 = total KB, 2 = total B, 3 = total MB). default is 0.
-c : number of updates. default is 0 (unlimited).
-t : tracemode.
-p : sniff in promiscious mode (not recommended).
-s : sort output by sent column.
device : device(s) to monitor. default is all interfaces up and running excluding loopback
When nethogs is running, press:
q: quit
s: sort by SENT traffic
r: sort by RECEIVE traffic
m: switch between total (KB, B, MB) and KB/s mode
@FransM
Maybe I ran nethogs -h inside the Raspberry Pi board which have a more recent version of the program (0.8.5-2).
If I run it in Ubuntu 16.04.3, I get the same output as yours.
I also use “iftop” to see which servers my box is connecting to and using all the bandwidth.
If you want to get really fancy, “ntop” works very well, it provides a Web GUI.
If it would be possible that PPP needs 10,000 bytes for a payload of just 300 bytes I wonder how we managed to establish dial-up connections 3 decades ago over phone lines at 2400 baud rate? 🙂
tkaiser,
The main problem is that I am fairly inexperienced with using PPP in general and beginner’s level experience using it in a cellular system (Hologram). I have checked some basic stuff like, ensuring updates on the computer are disabled.
The small amount of comfort I have found is that CNX seems to get similar exchanges of data just doing a ping test.
The fact that the traffic can vary from 1K to 100K in a 20 second connect-time seems puzzling to me.
Cheers,
davef
Isolate your IoT traffic from the default physical interface as per your routing table. That should be the case if you are using ppp over /dev/ttyx for the IoT traffic and IP over Ethernet in the default route. If you are using IP over Ethernet for both traffic streams, try separating them by aliasing a different interface address on the same physical port and add the new interface as a non-default route.