
I’ve previously written about Intel’s (relatively) new NUC 9 range of mini PCs and now I am following up with my experiences of having bought one.
Whilst I’ll cover some performance metrics from both Windows and Ubuntu I’ll also discuss the benefits and drawbacks of using either OS together with a comparison of gaming, thermals, and power usage as well as a brief look at overclocking potential and implications together with highlighting the issues encountered.
NUC9i9QNX Hardware Overview
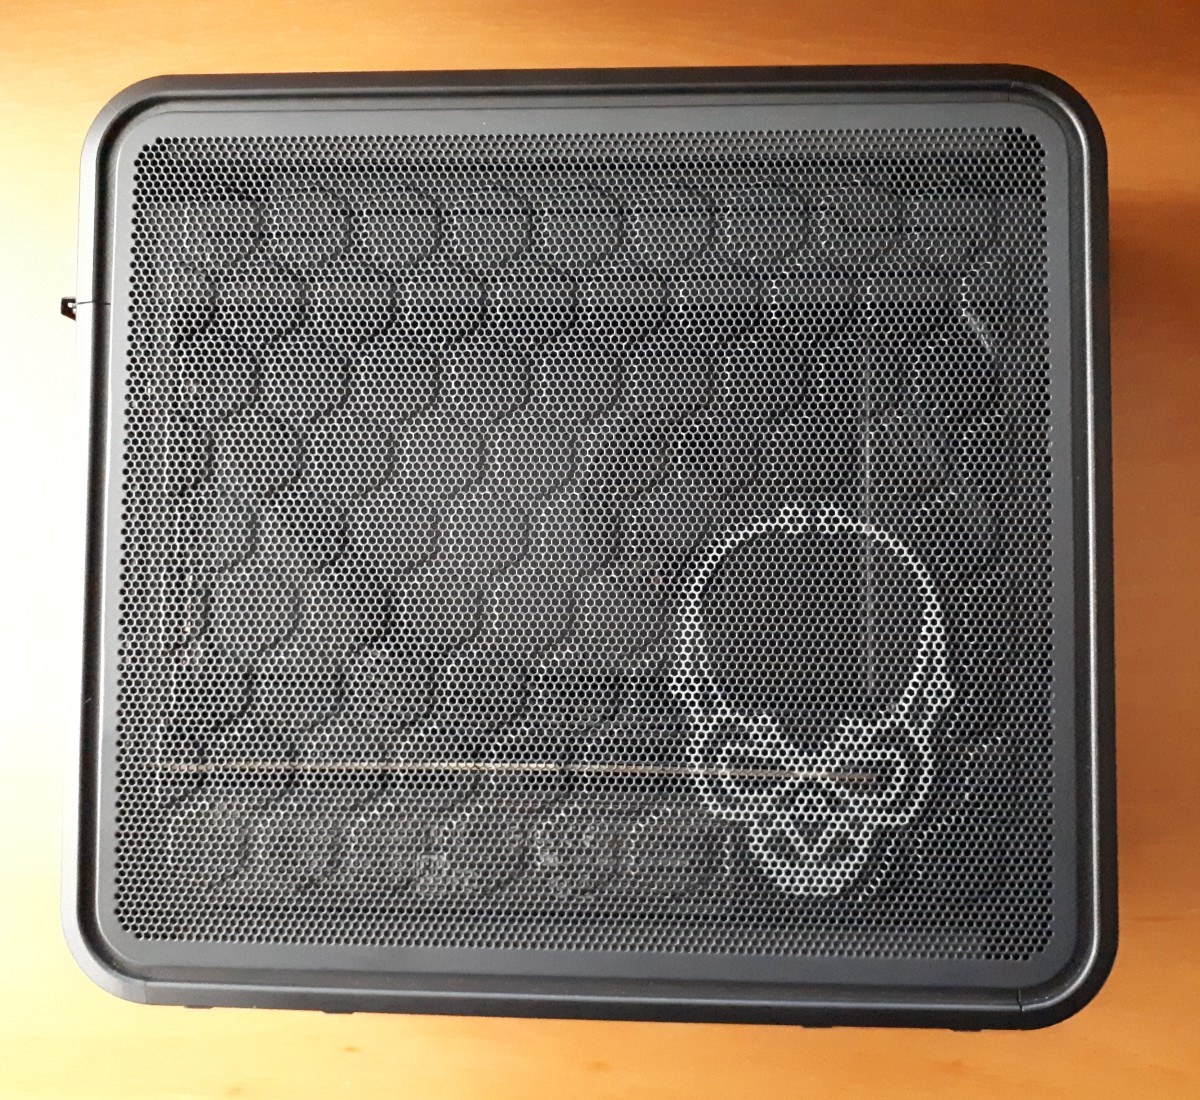
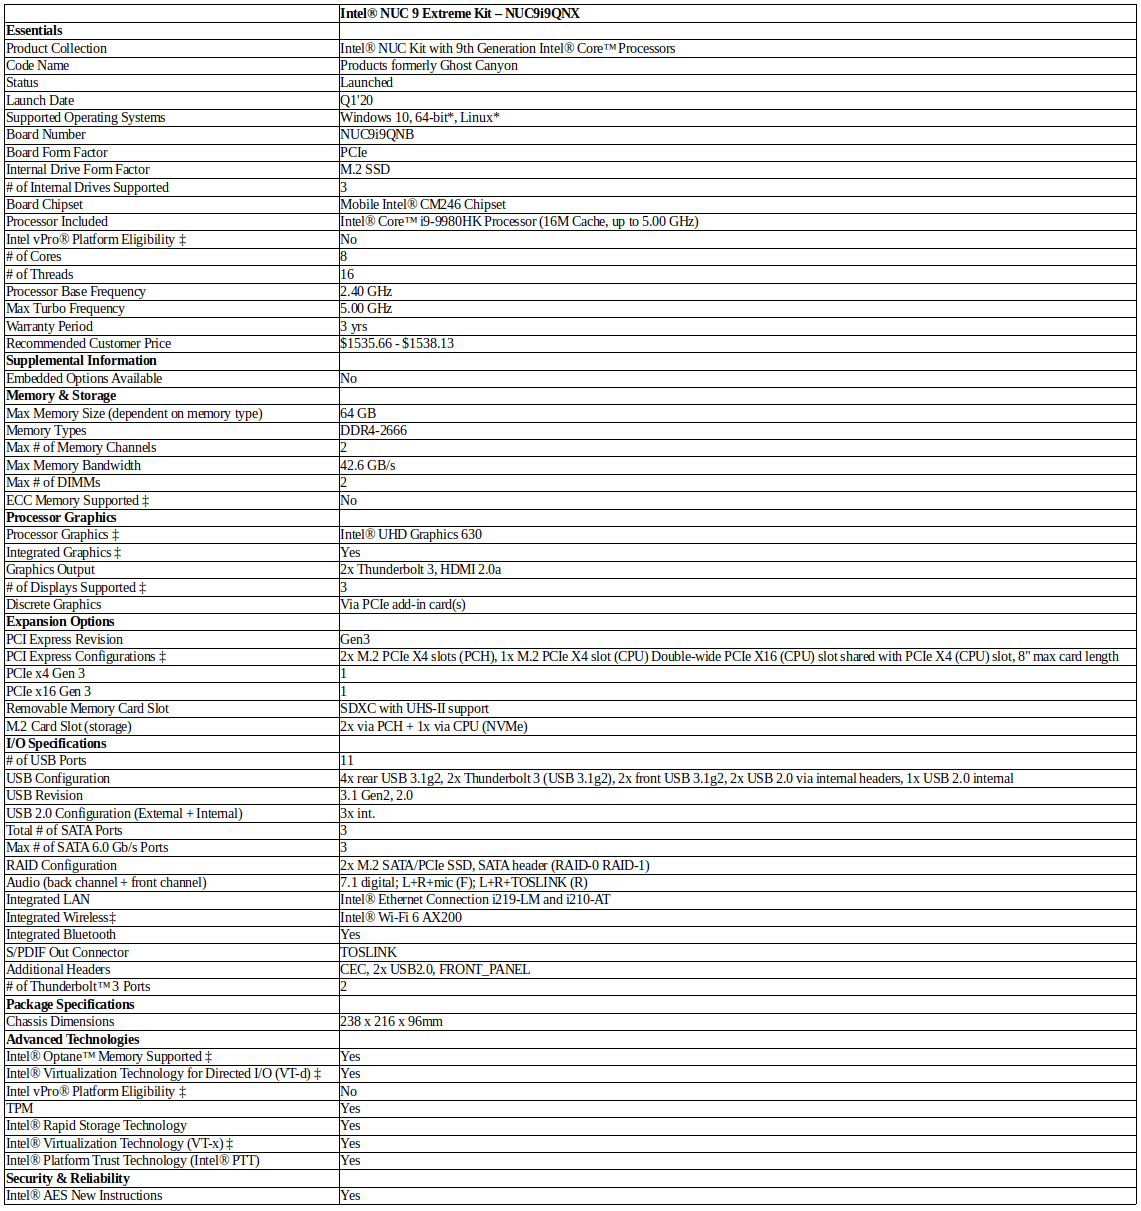
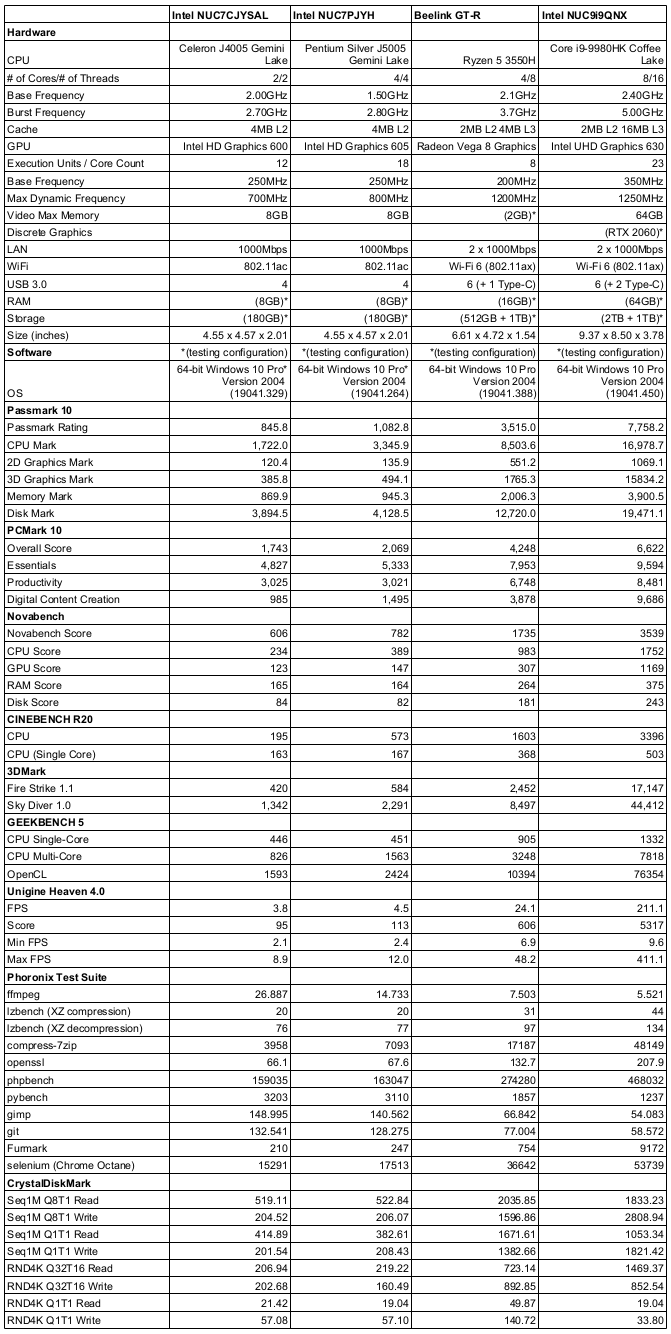
The model I purchased and will be reviewing here is the NUC9i9QNX from Intel’s Ghost Canyon lineup and is formally known as the Intel NUC 9 Extreme Kit – NUC9i9QNX. It contains a “Compute Element” with an i9-9980HK which is an eight-core 16-thread 2.40 GHz processor boosting to 5.00 GHz with Intel’s UHD Graphics 630. The full specifications of the NUC9i9QNX include:
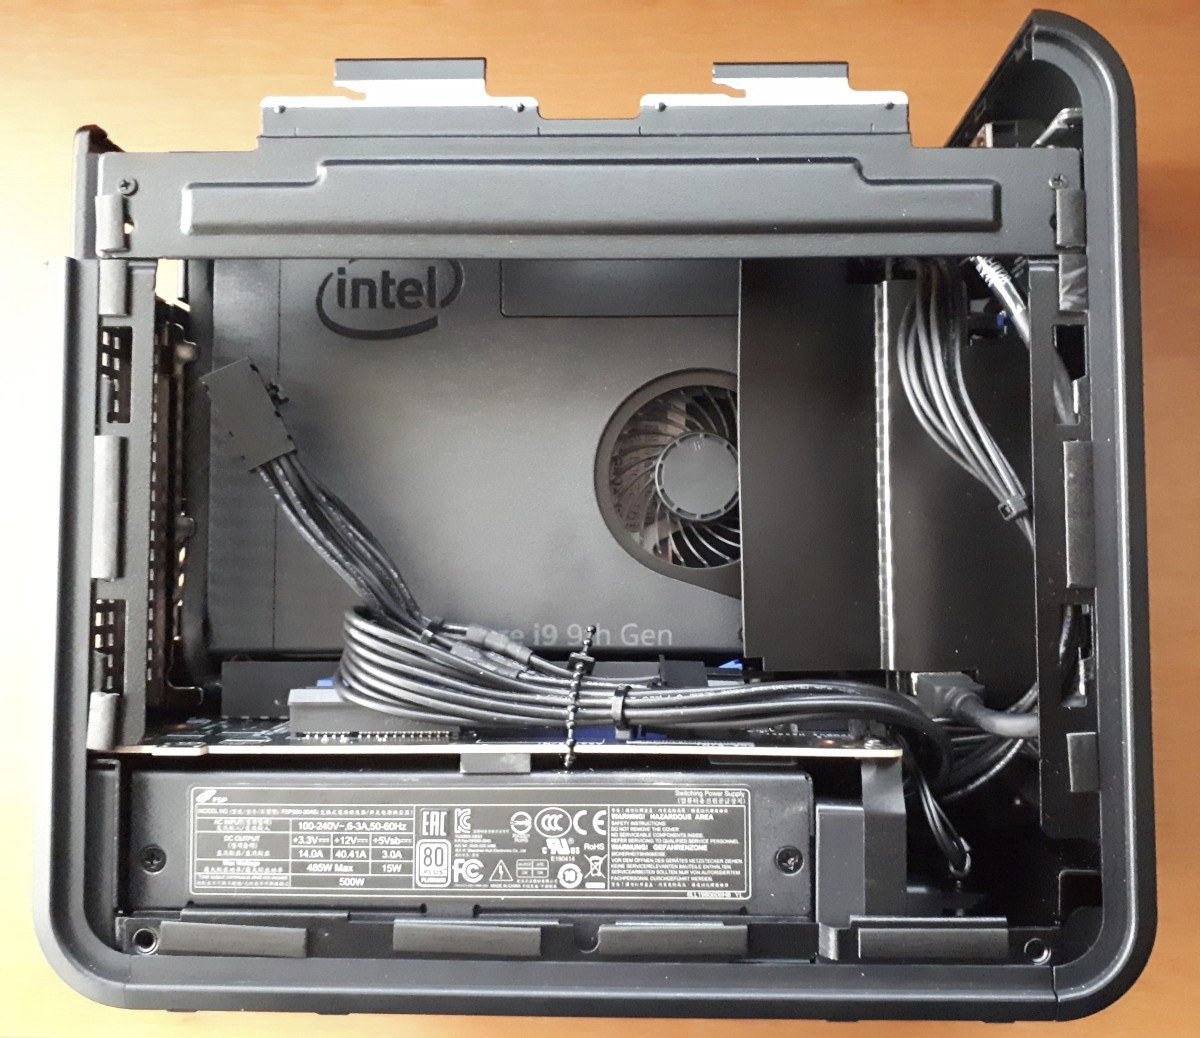
The NUC9i9QNX is sold as a kit which essentially means barebones as it consists of a case containing a baseboard, power supply, and the Compute Element pre-installed:
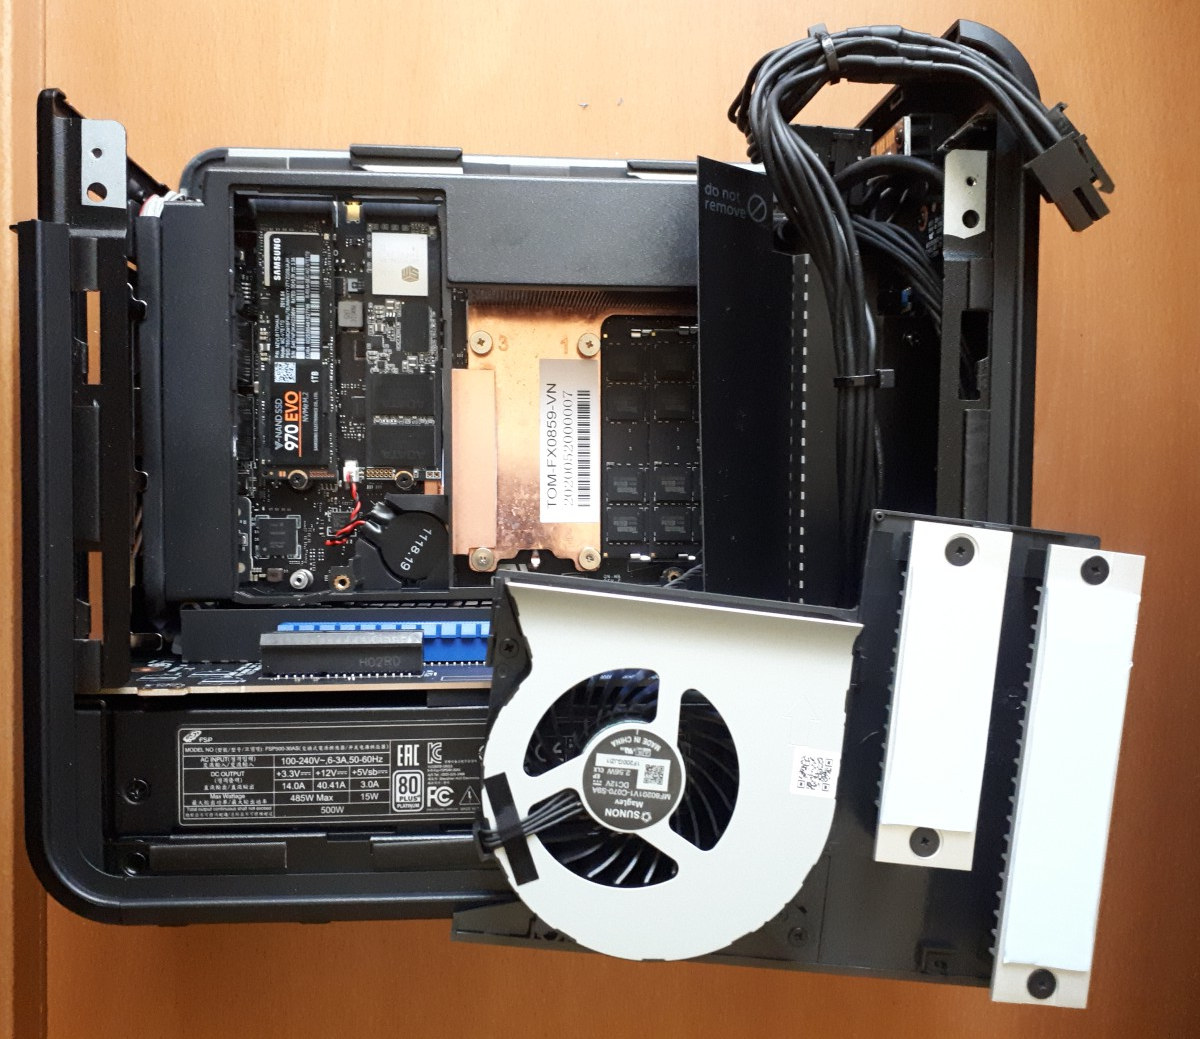
By removing the top and a side panel of the NUC the Compute Element is accessible allowing its front panel to be removed to access the M.2 and memory slots:
I wanted to use the mini PC as a dual-boot device with Ubuntu for development and running multiple VMs as well as Windows for WSL and occasional gaming.
So I purchased a pair of 32GB (i.e. 64GB in total) Team Elite 260-Pin SODIMM DDR4 3200MHz laptop memory. I also purchased an XPG SX8200 Pro 2TB NVMe and decided to reuse an existing Samsung 970 EVO 1TB NVMe for the two M.2 2280 SSDs in the Compute Element.
There is another M.2 slot but that requires removing the Compute Element first:
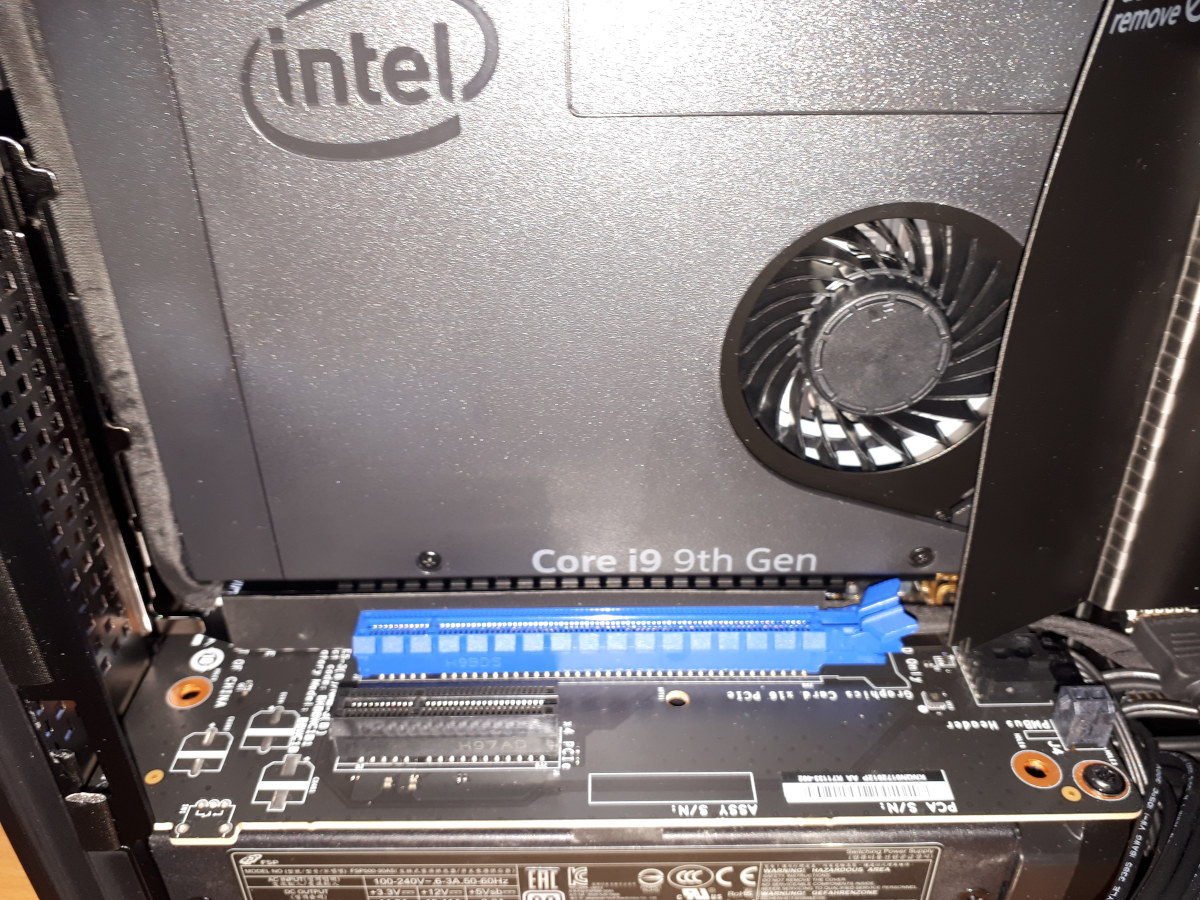
Into the blue PCIe slot I also purchased and installed an EVGA GeForce RTX 2060 KO ULTRA GAMING graphics card:
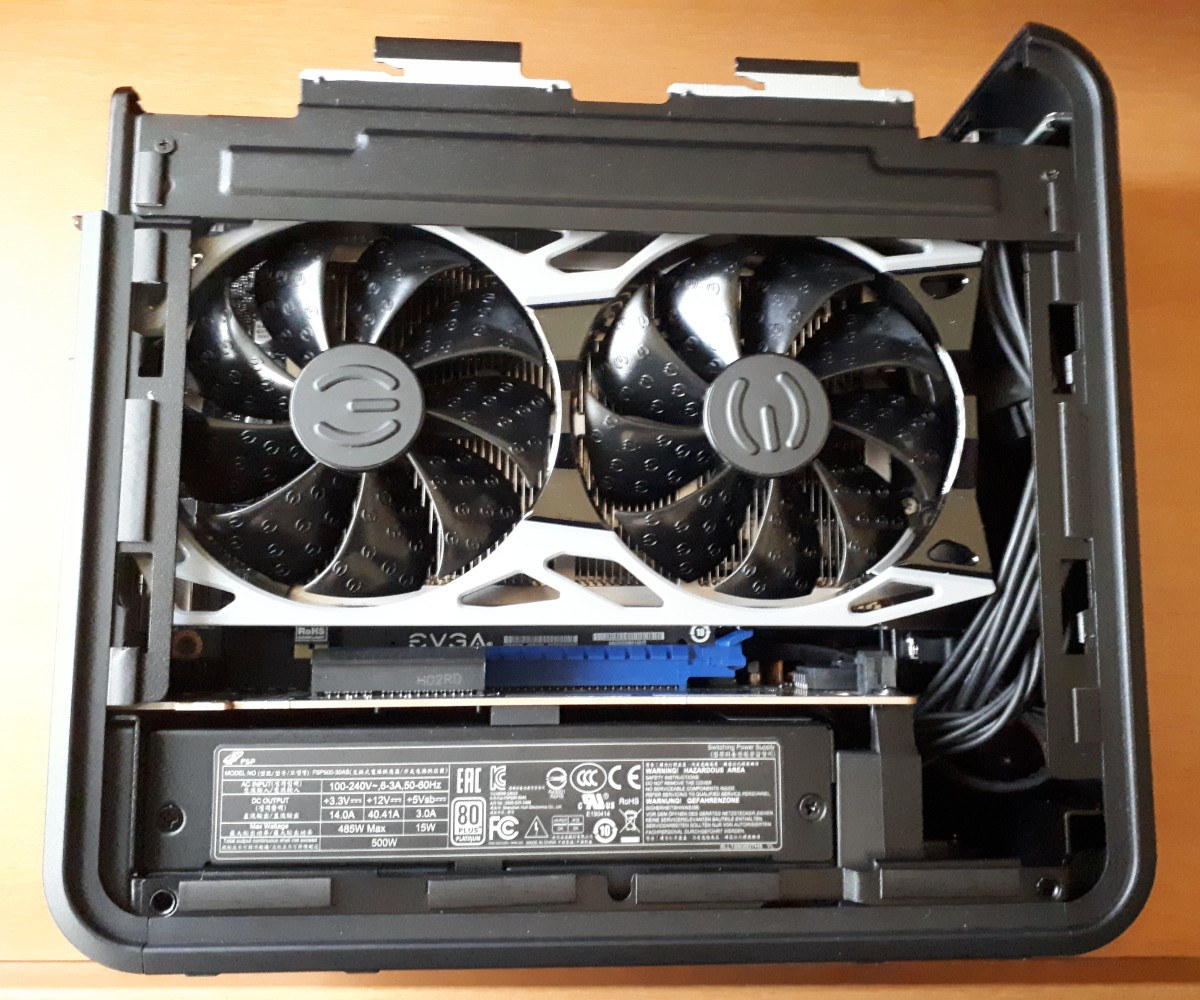
as I wanted to see how ray tracing improved the visual experience plus I was limited in my choice of graphics cards due to the maximum length supported by the NUC9i9QNX (i.e. 202mm or approximately 8 inches).
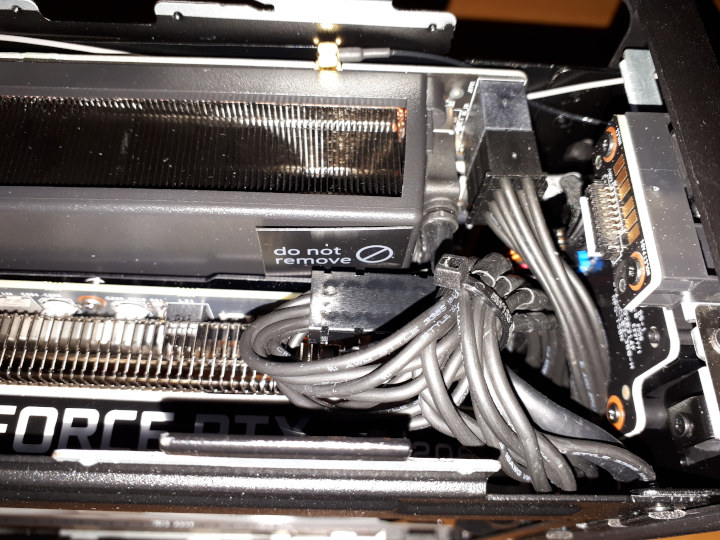
In terms of accessibility, installing the M.2 drives and memory was relatively straightforward albeit a little fiddly given space is somewhat restricted. The graphics card however is a tight fit. The hardest part is connecting the power cable to the card and fitting the cables around the card and into the small space for cable management. I recommend first removing the power and USB cables from the top of Compute Element which gives you more room to work and allows the unused PCIe 6+2 pin power cable to be bent backwards and downwards parallel to itself:
Packaging Contents
Besides the NUC, you also get a large hard-plastic carrying case complete with a strap with metal latches that comes enclosed in a “soft-to-touch” wrap-around cardboard box with magnetic catch. Inside, in a hidden compartment in the carrying case is a power cable and the outer box includes a quick start guide, a regulatory information sheet, and a safety information sheet. What you don’t get is the blacklight torch that all the reviewers talked about.
Review Methodology
When reviewing mini PCs I typically look at their performance under both Windows and Linux (Ubuntu) and compare against some of the more recently released mini PCs. Specifically, I am now reviewing using Windows 10 version 2004 and Ubuntu 20.04 LTS and test with a selection of commonly used Windows benchmarks and/or equivalents for Linux together with Thomas Kaiser’s “sbc-bench” which is a small set of different CPU performance tests focusing on server performance when run on Ubuntu. I also use “Phoronix Test Suite” and now benchmark with the same set of tests on both Windows and Ubuntu for comparison purposes. On Ubuntu, I also compile the v5.4 Linux kernel using the default config as a test of performance using a real-world scenario.
Prior to benchmarking, I perform all necessary updates and/or installations to run the latest versions of both OSes. I also capture some basic details of the mini PCs under review for each OS.
Installation Issues
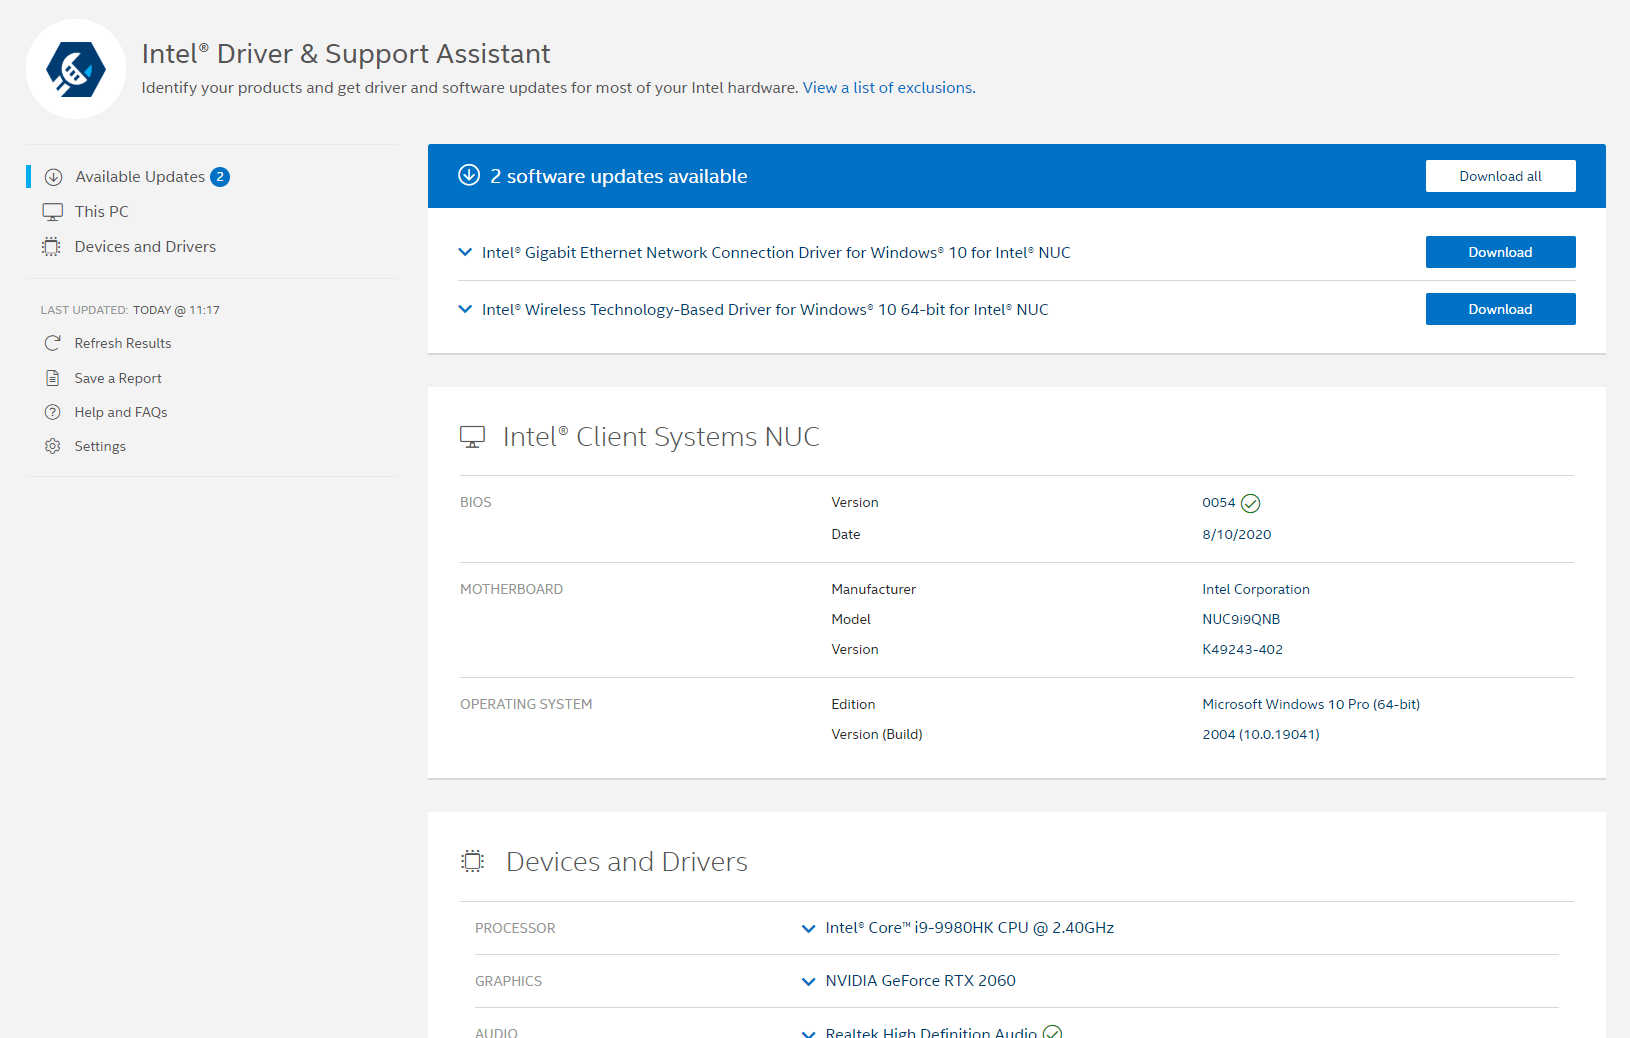
I first installed Windows to the XPG SX8200 Pro 2TB NVMe M.2 drive. In my particular case, because the Samsung 970 EVO 1TB NVMe M.2 drive already contained an Ubuntu 18.04 installation and, more importantly, an EFI partition, the Windows installation simply reused the EFI partition for the Windows boot files. Installing Windows was straightforward although I did notice that Cortana didn’t speak but that was probably due to drivers not being initially installed. Running Intel’s “Driver & Support Assistant” updated the ethernet and wireless drivers after all other updates had been applied:
Installing the Windows benchmarks went smoothly with the exception of the “Selenium” test from the “Phoronix Test Suite”. When running the test with “Chrome” selected it errors with “cannot find Chrome binary”: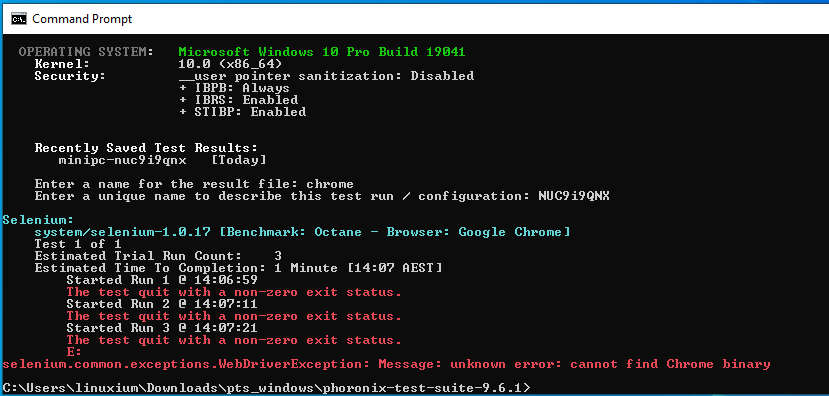
As a result, the Octane tests were run manually and edited into the final results.
Prior to installing Ubuntu 20.04, I shrunk the XPG SX8200 Pro 2TB NVMe M.2 drive by half to allow 1TB for Windows and 1TB for Ubuntu. The Ubuntu installation required booting the “liveUSB” using “safe mode” otherwise it simply freezes with a black screen and a couple of multicolored lines at the top. Unfortunately once successfully booted the screen is then restricted to an 800×600 resolution with very large text. After starting the installation, by moving the window up the screen as much as possible you can just see the top of the selection boxes at the bottom of the screen. Each screen’s “Continue” box is the one on the bottom right and can just be clicked to proceed.
It is easiest to select “Install third-party software for graphics” to add the additional Nvidia 440 drivers required by the RTX 2060 graphics card and configure secure boot then “Enroll MOK” on reboot noting that you will now get a “Booting in insecure mode” message as GRUB loads. Again the Samsung 970 EVO 1TB NVMe M.2 drive’s EFI partition was reused for the Ubuntu boot configuration.
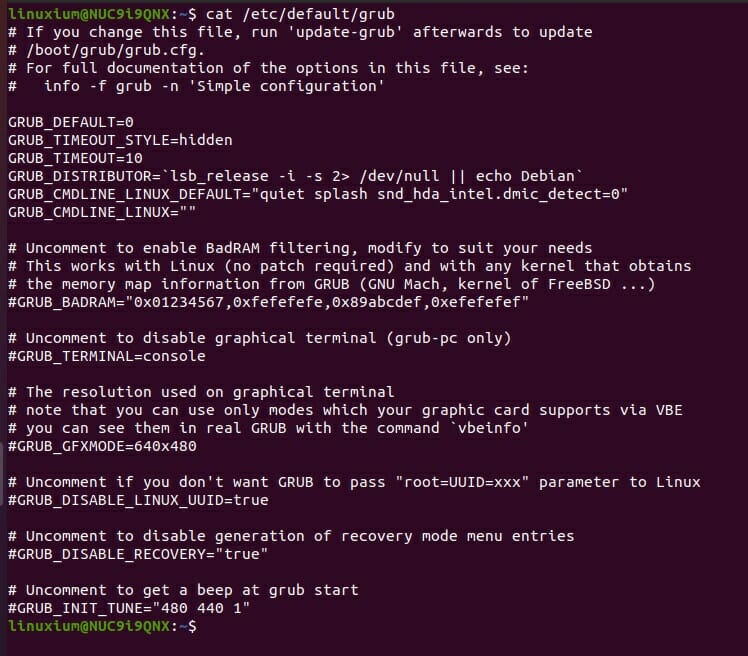
The key issue however with Ubuntu 20.04 (and not found with Ubuntu 18.04) was that booting hangs and “dmesg” fills up with errors. I found I needed to add “snd_hda_intel.dmic_detect=0” as a kernel parameter in order to boot so I added this to “/etc/default/grub”:
Windows Performance
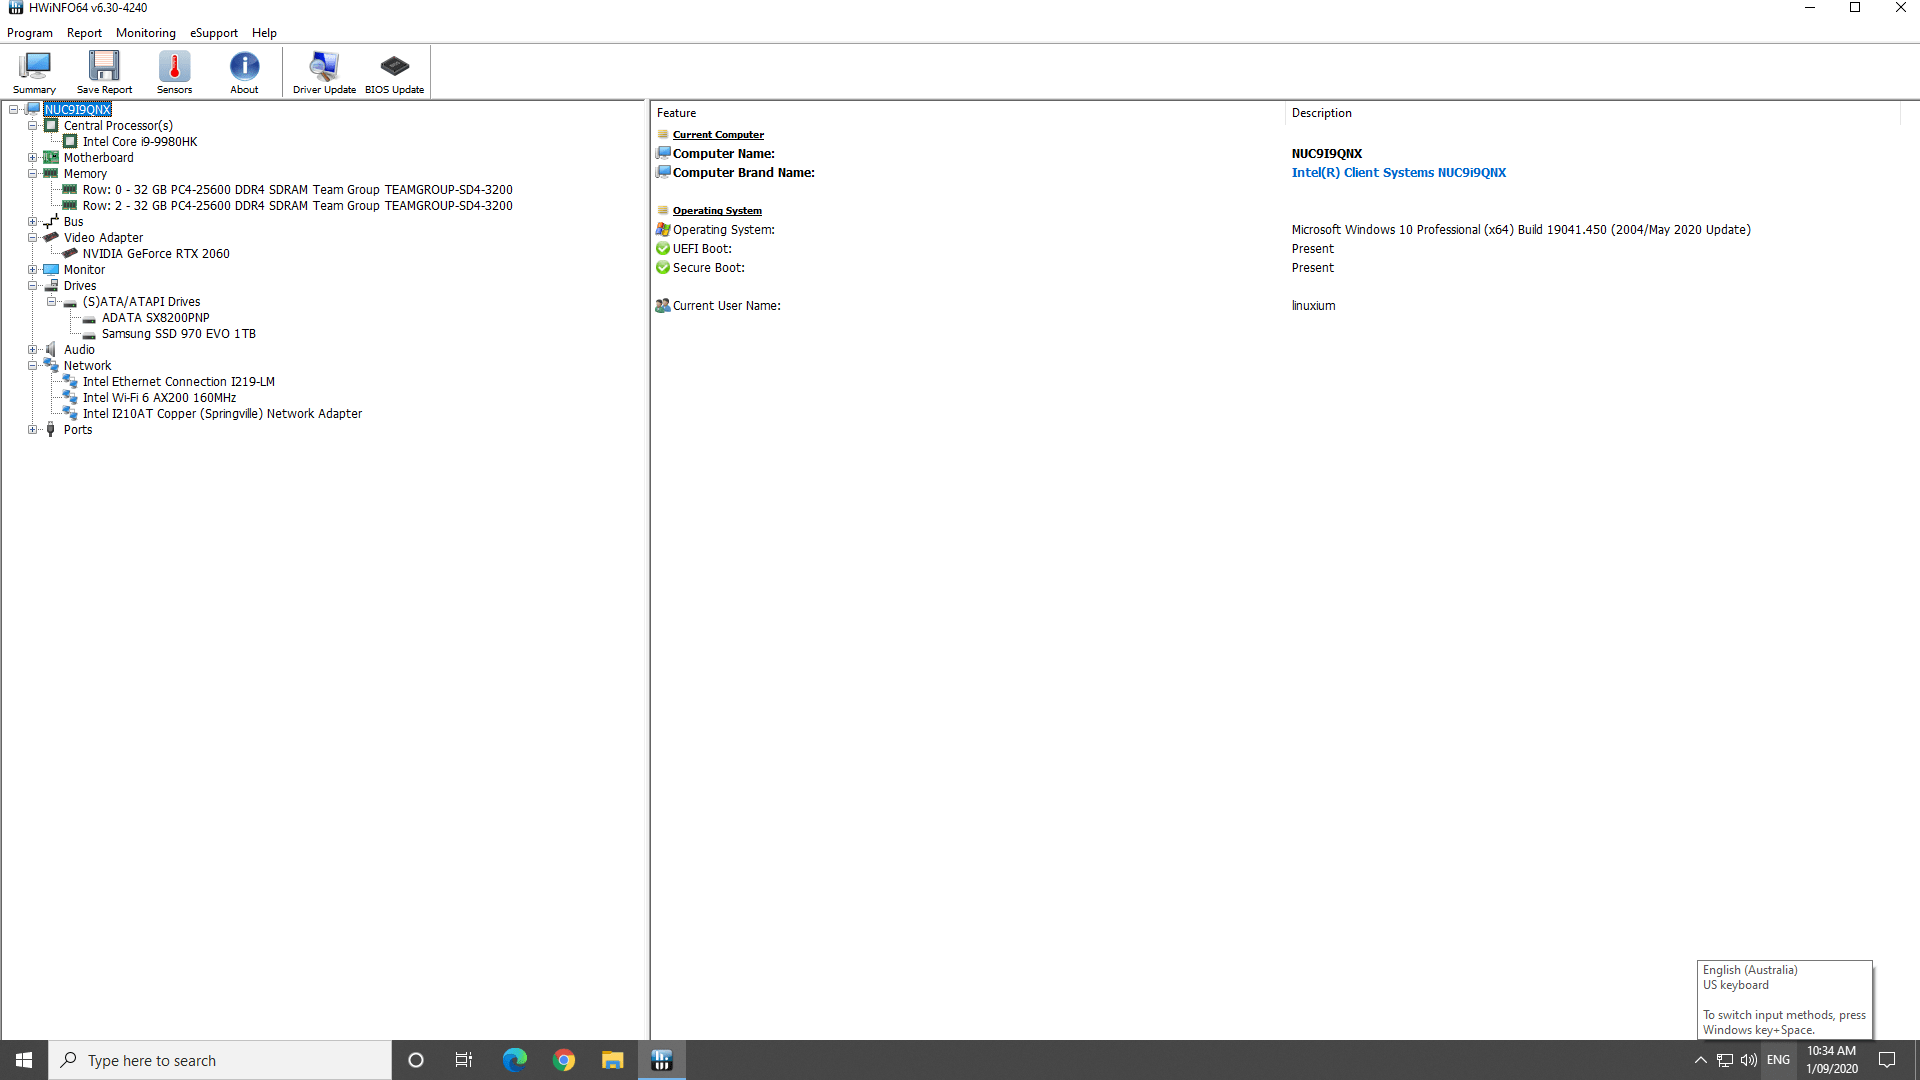
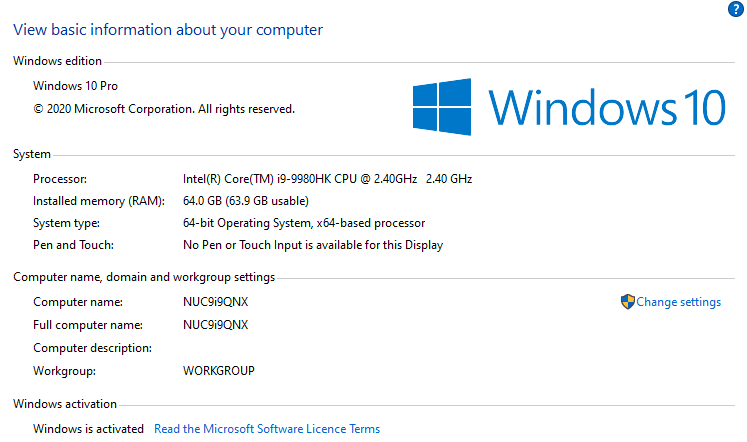
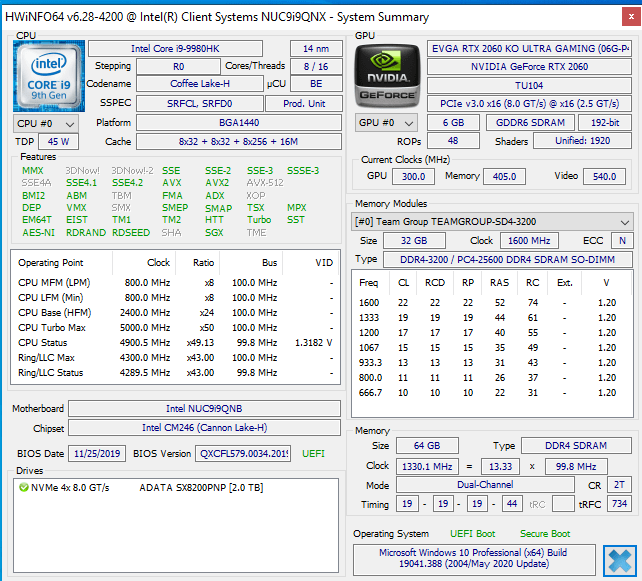
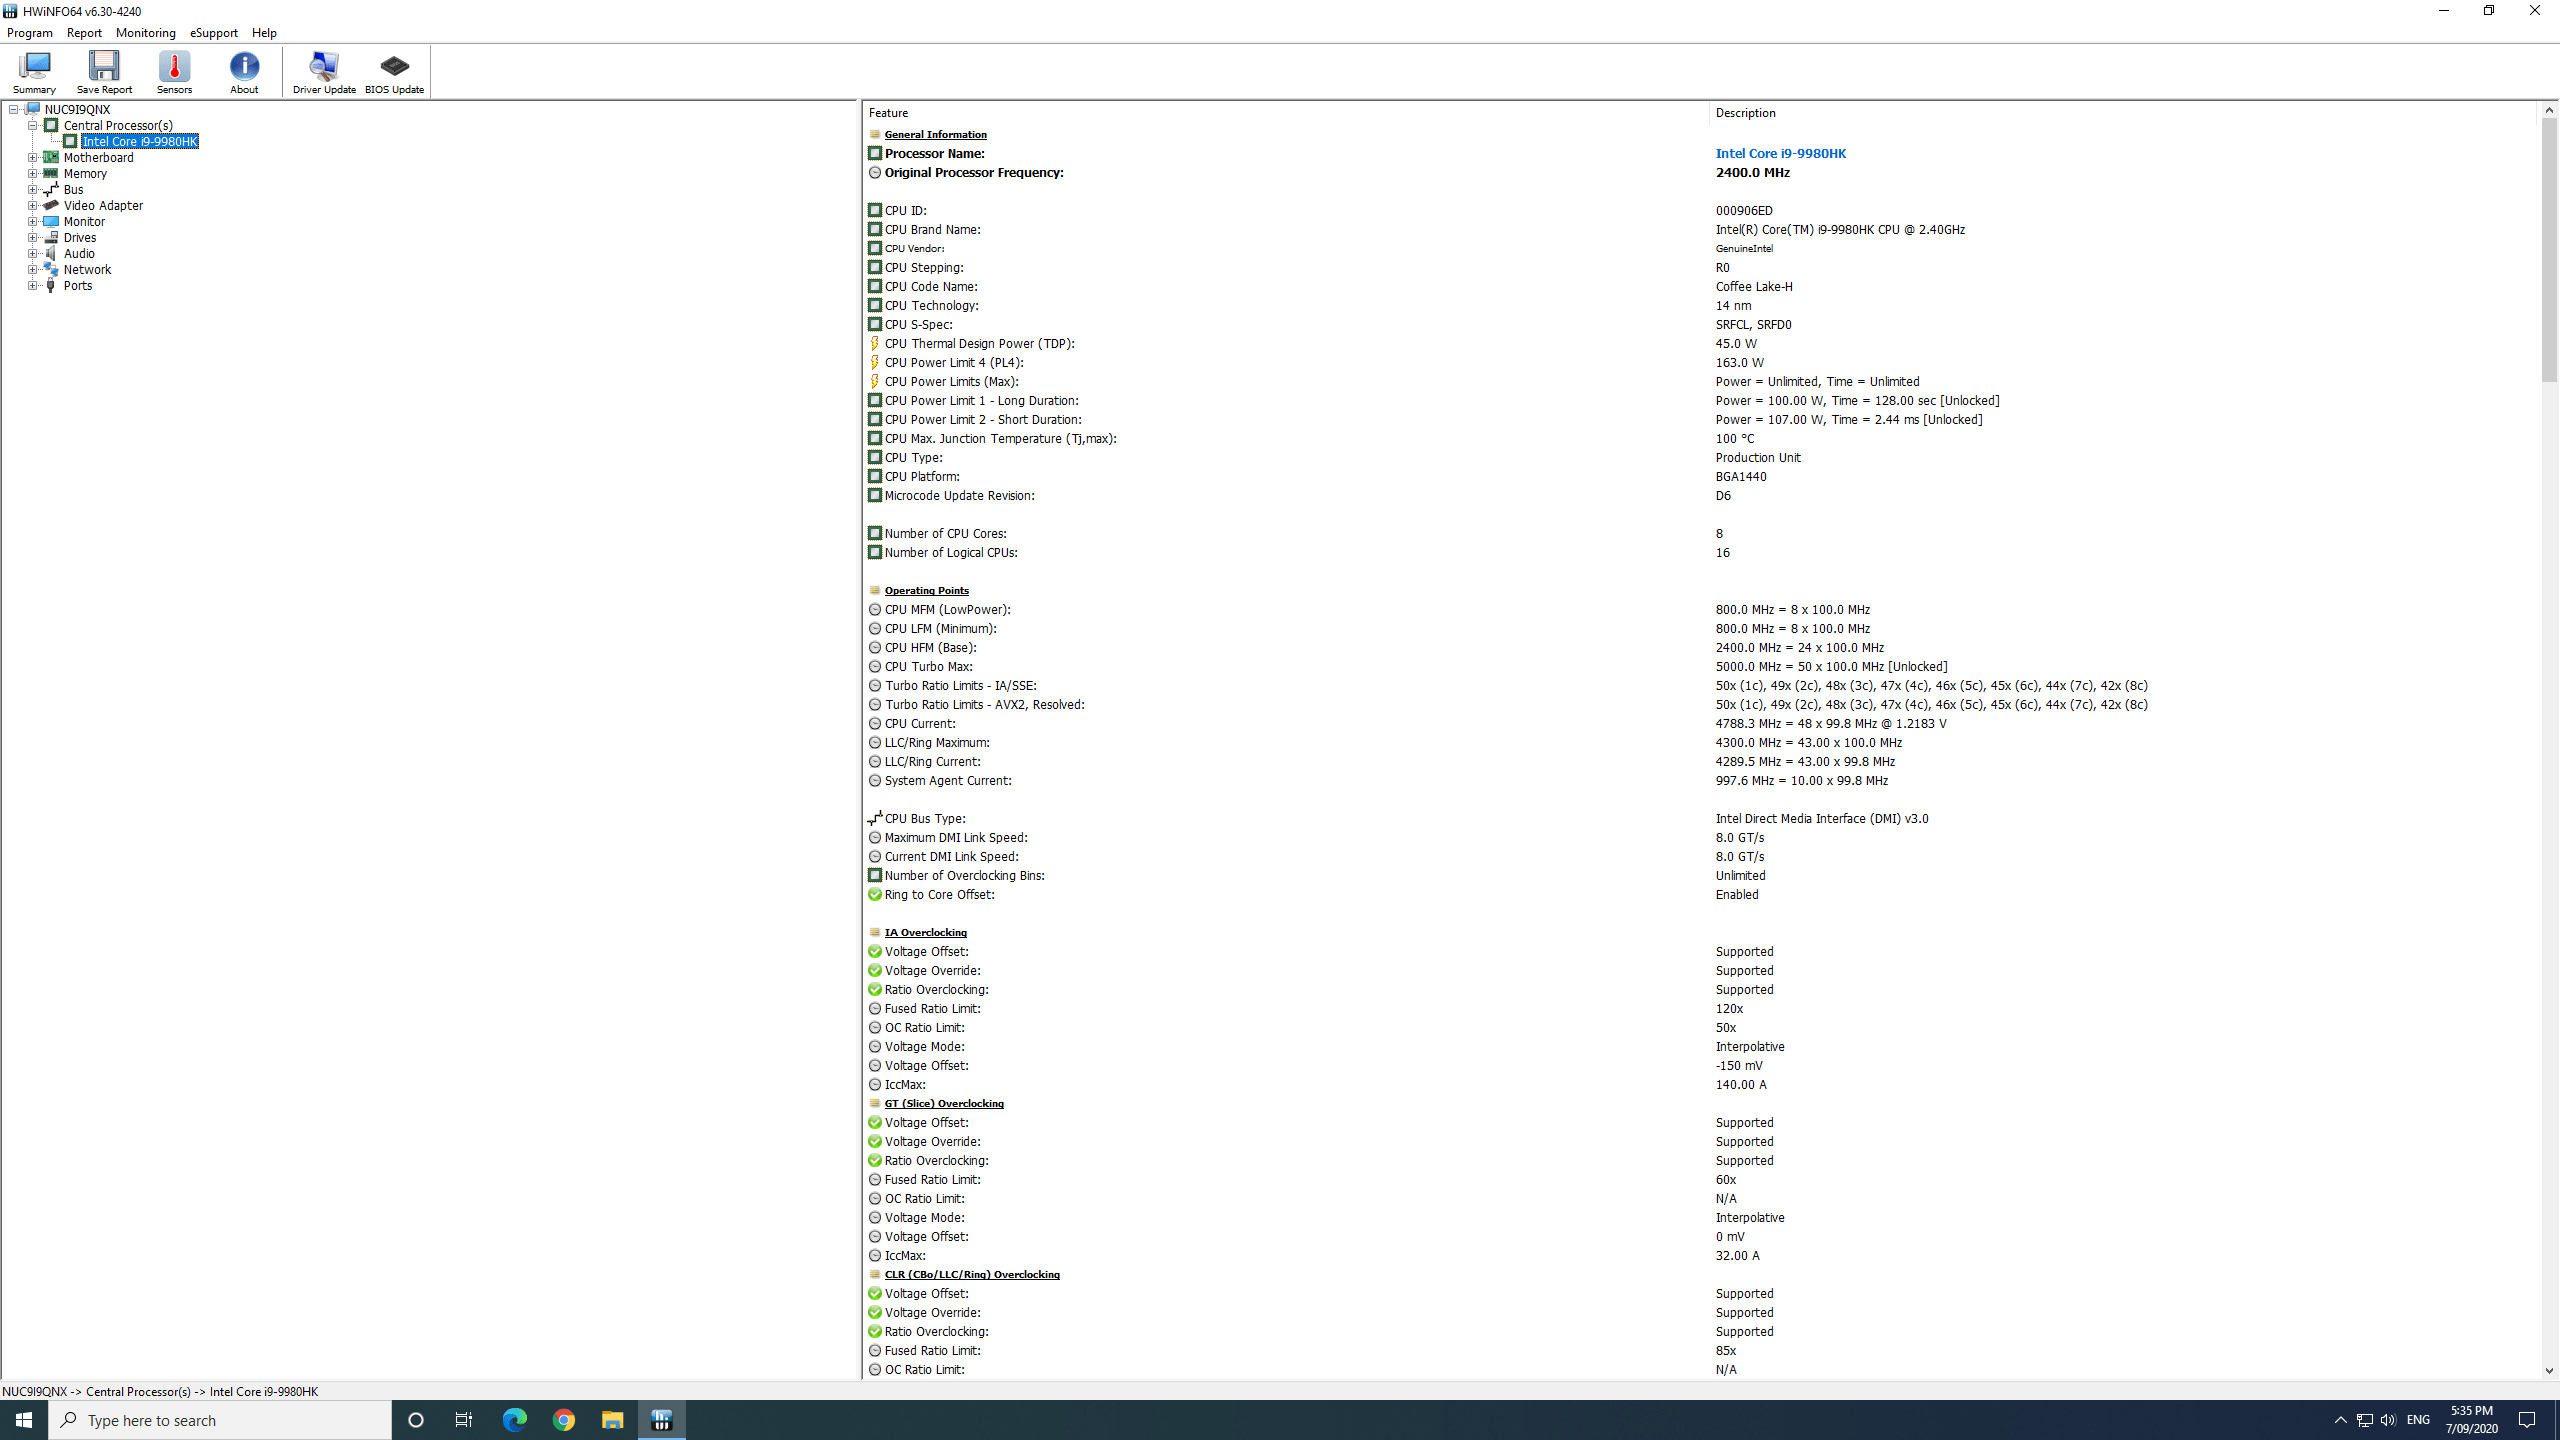
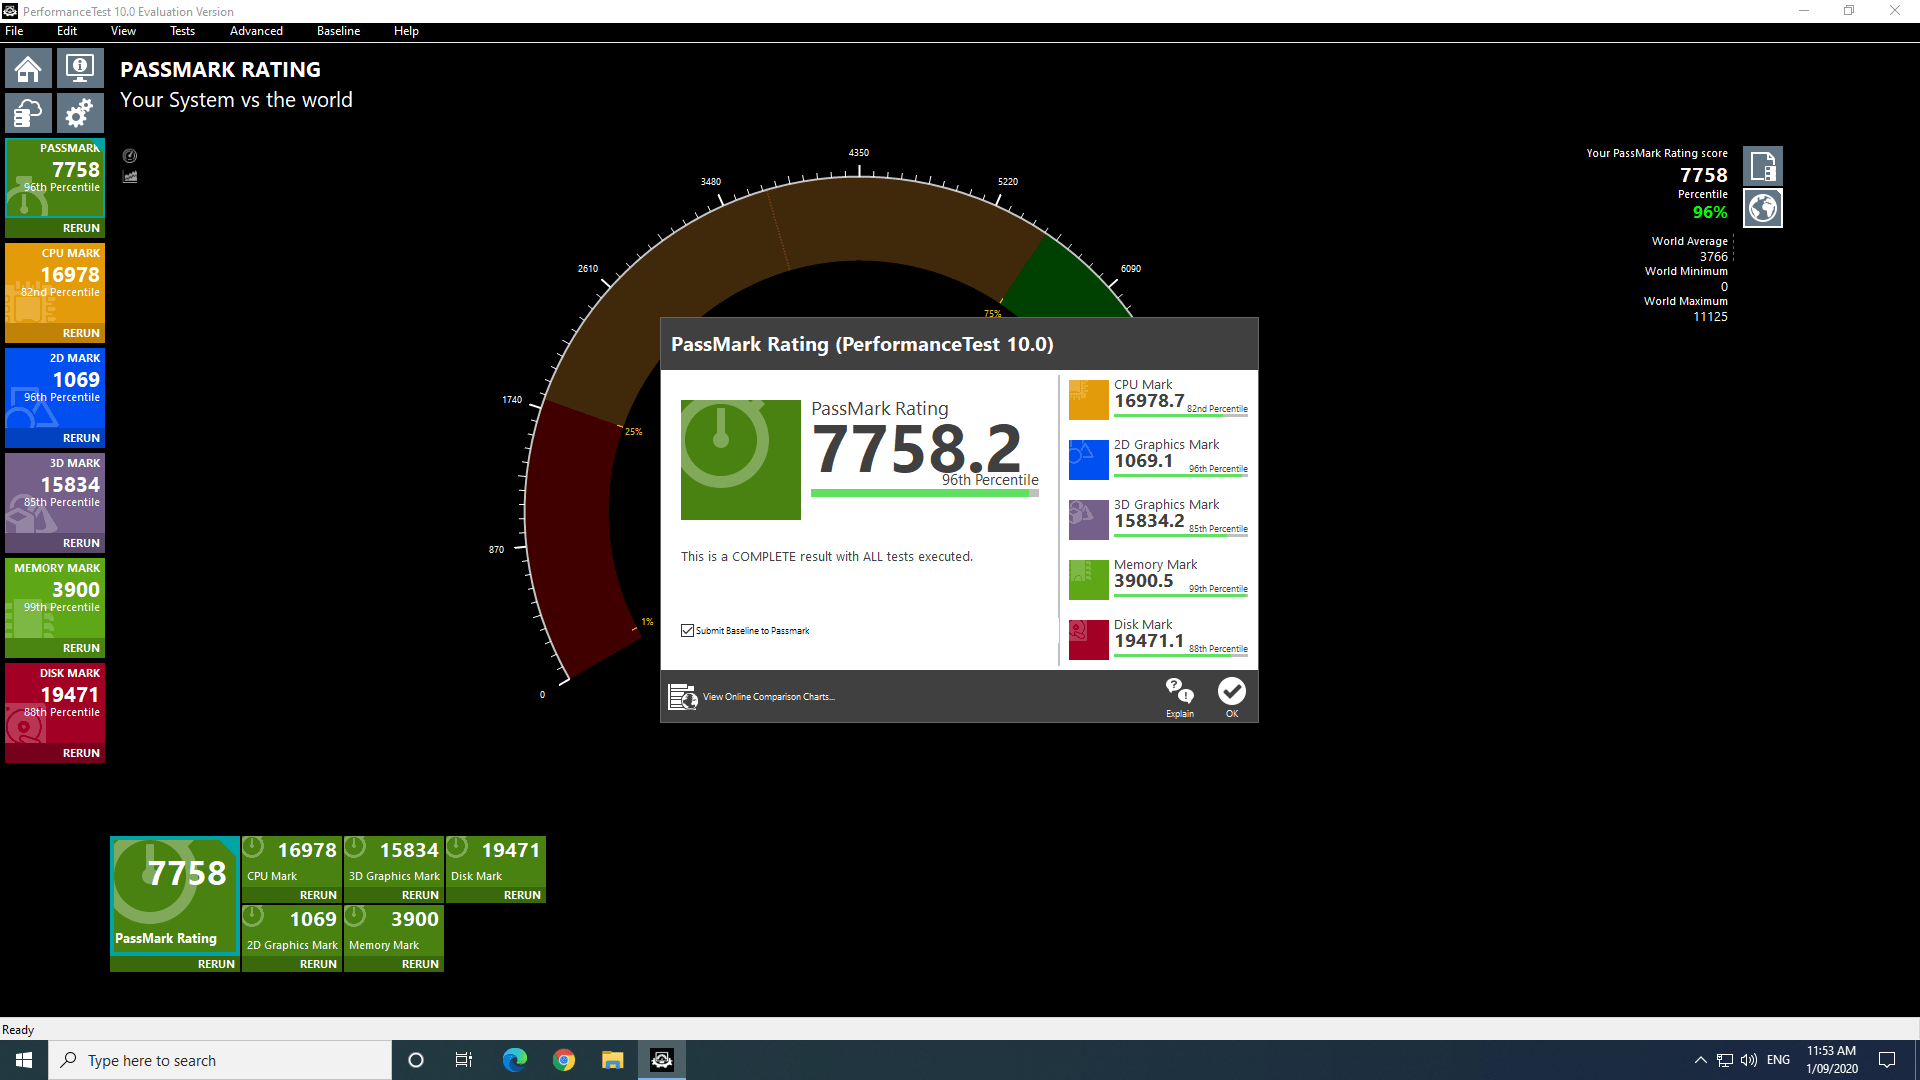
I installed Windows 10 Pro version 2004 and activated it with a genuine license key and updated it to OS build 19041.450. A quick look at the hardware information shows:
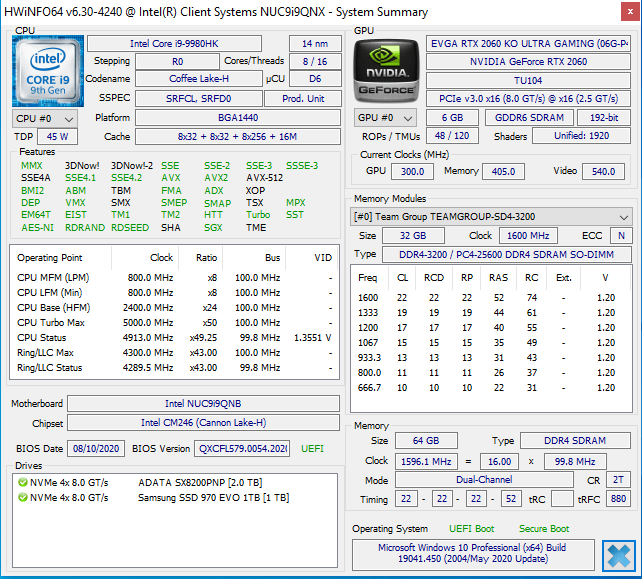
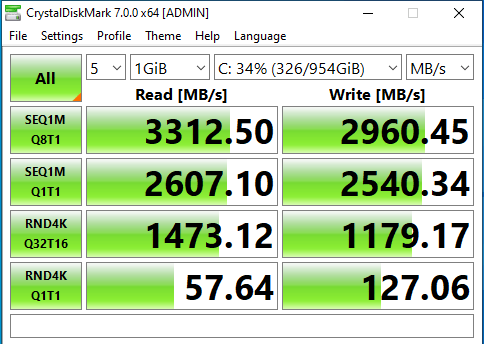
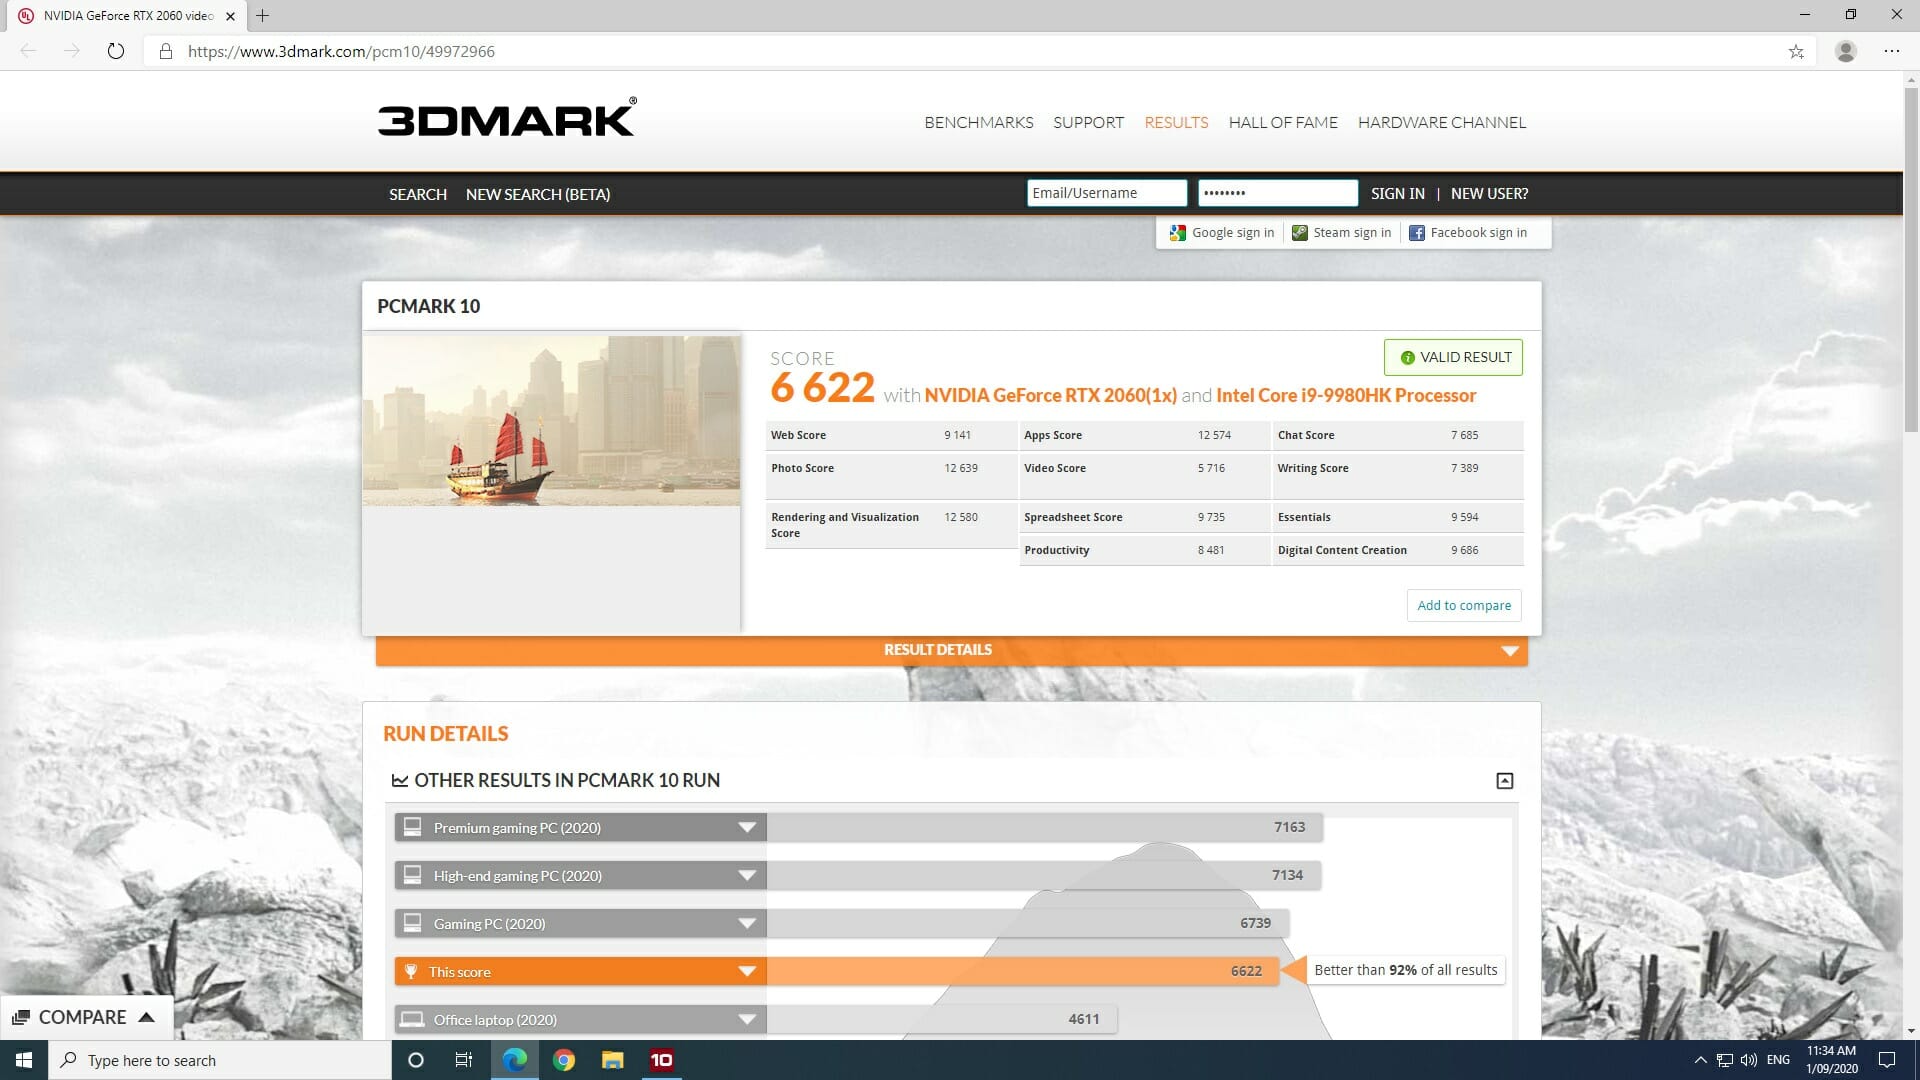
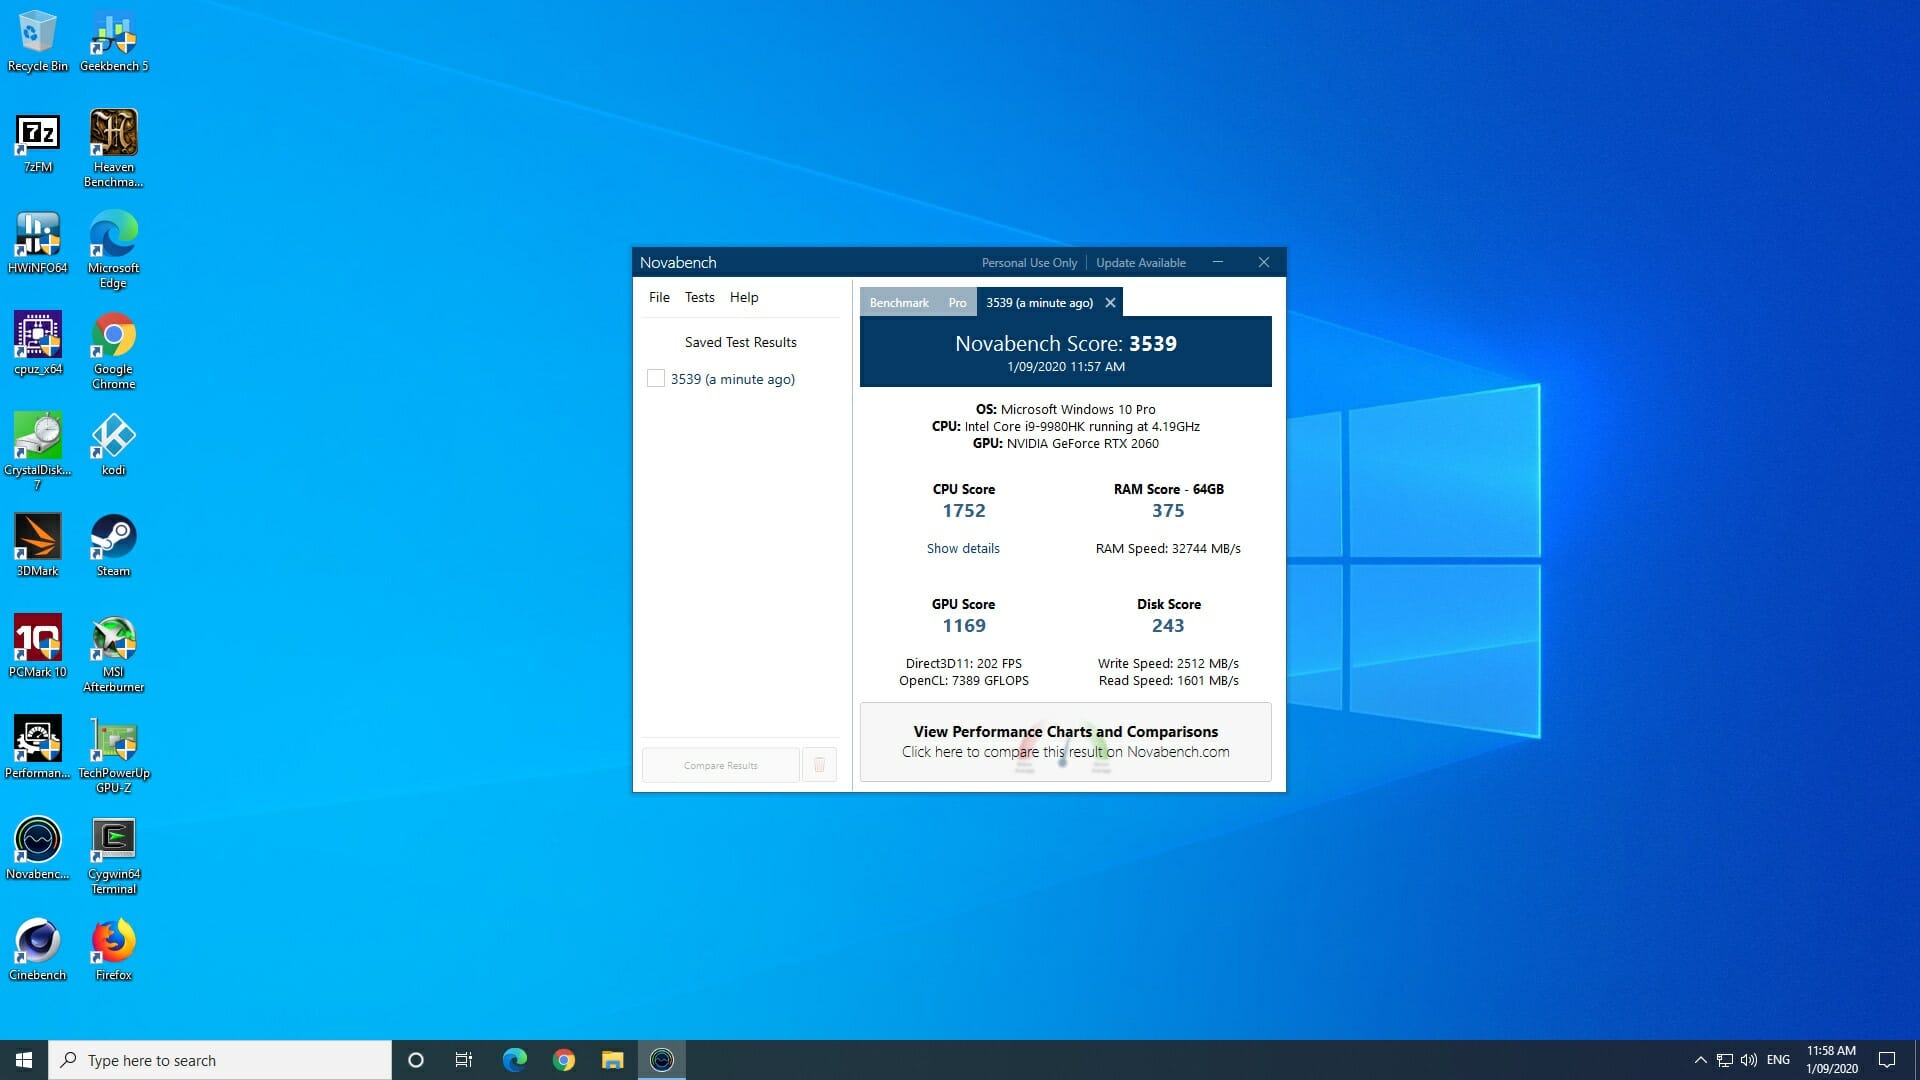
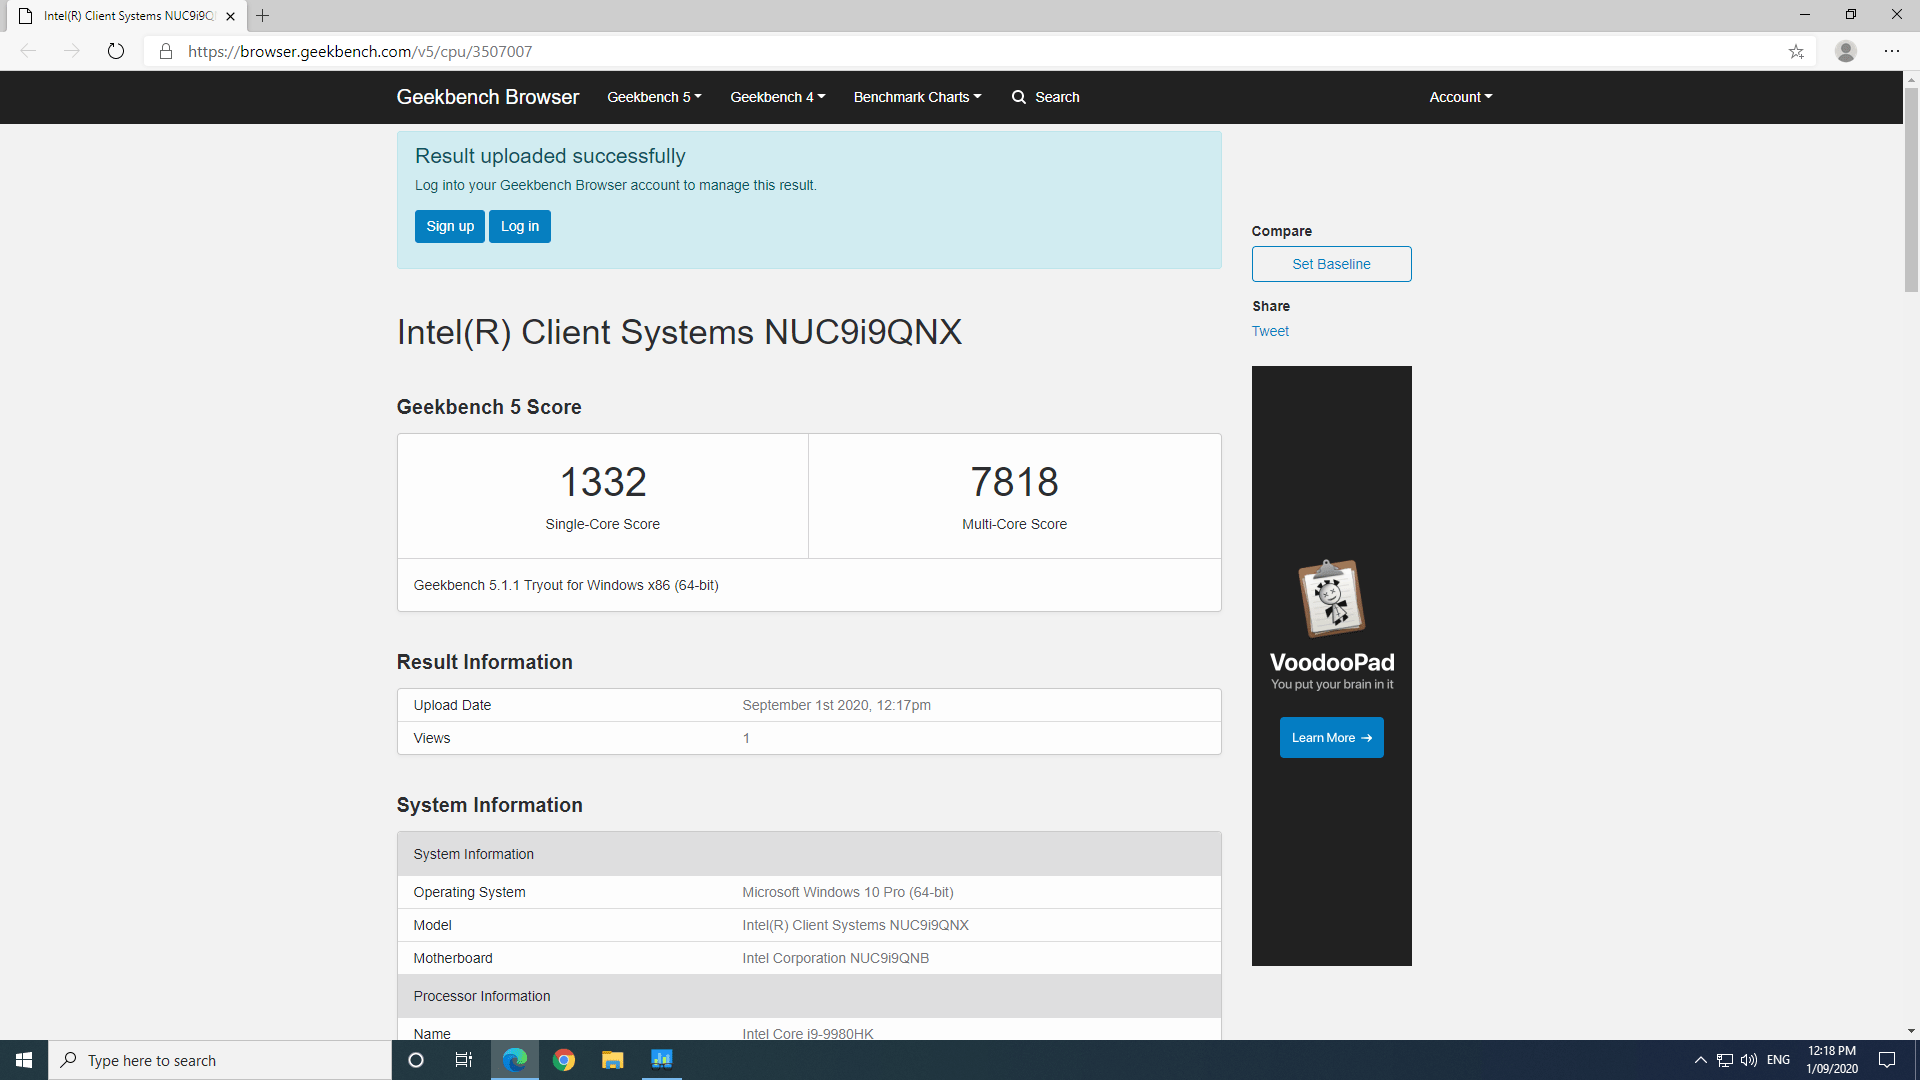
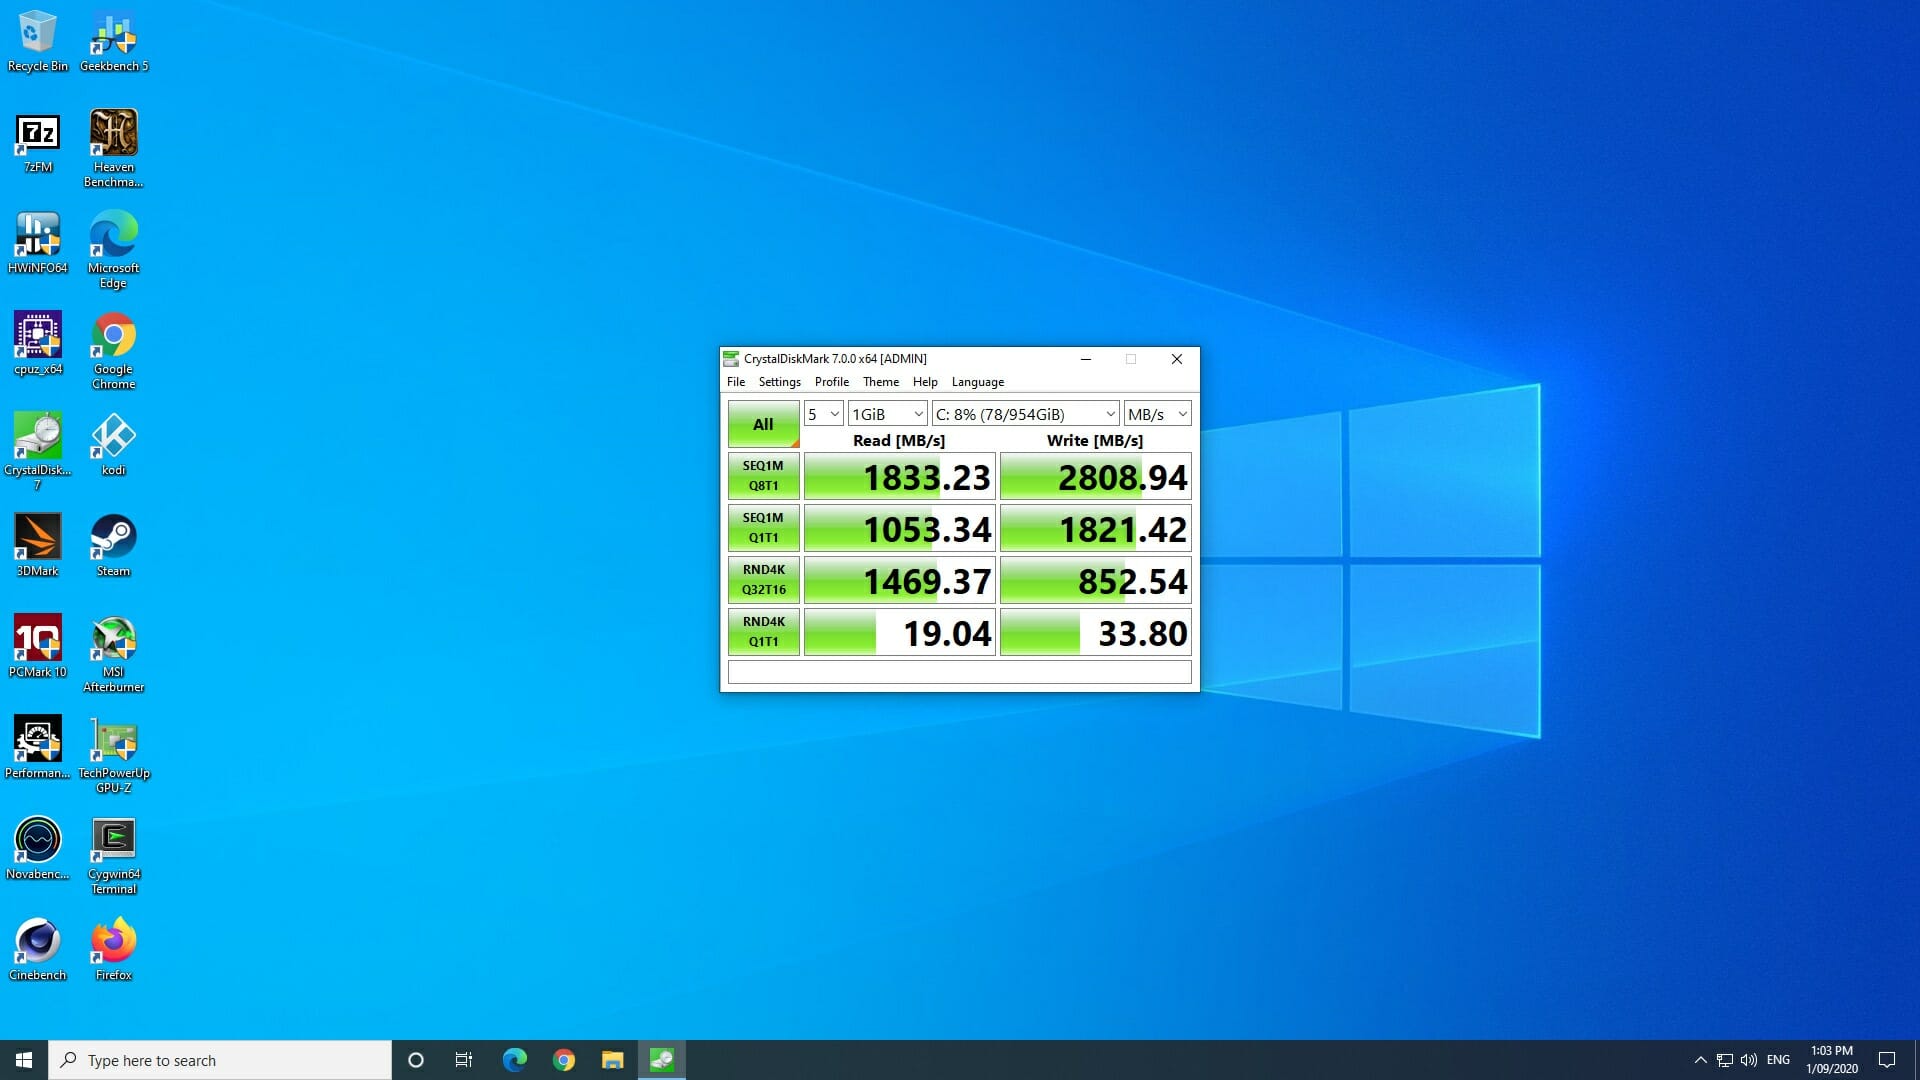
I then ran my (2020) standard set of benchmarking tools to look at performance under Windows:
This highlighted my first issue with the NUC9i9QNX namely the NVMe M.2 SSD performance and at this point, I need to pause the Windows performance discussion to expand on this issue.
Because I saw that the XPG M.2 performance was slower in the NUC9i9QNX than I had seen when I first tested the drive in a different PC immediately after purchasing it, I re-tested the M.2 in another PC just to reconfirm it worked to its specification:
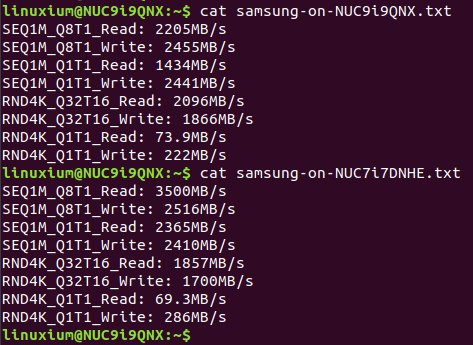
I then reinstalled it back into the NUC9i9QNX and added an Ubuntu partition to it and then tested the drive using “fio”. I got similarly poor results. I then removed the drive and put it in my NUC7i7DNHE and tested it again both Windows and Ubuntu:
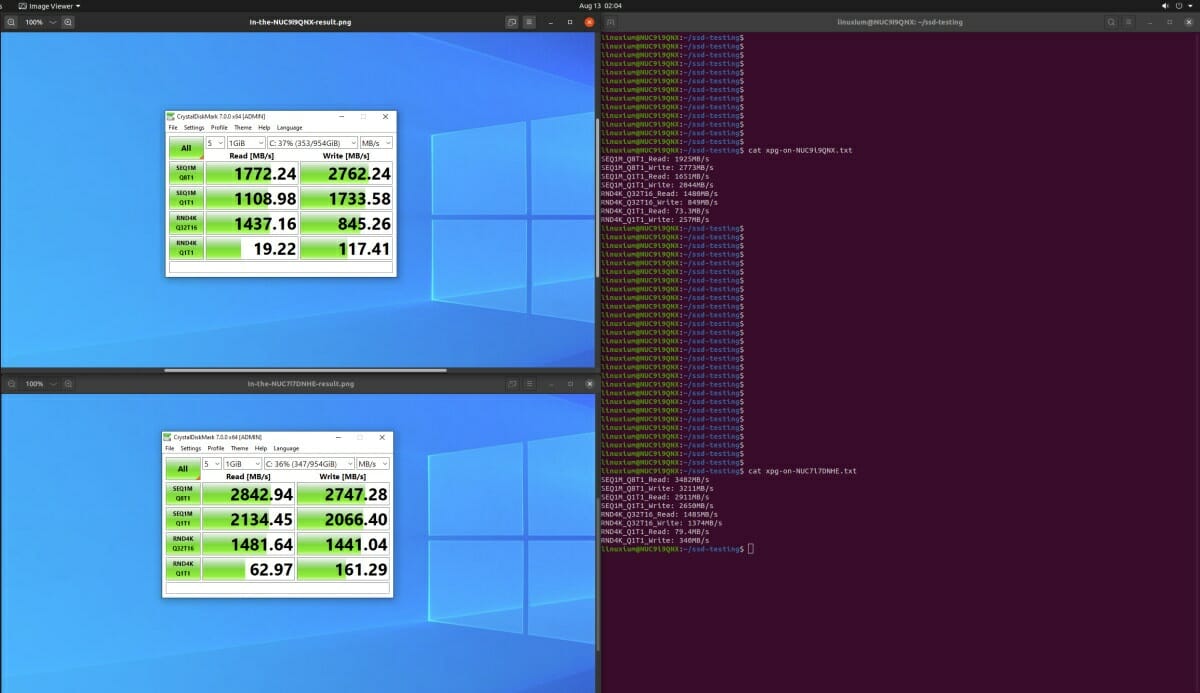
Finally to establish that it wasn’t just that drive at issue in the NUC9i9QNX I also tested the Samsung M.2 drive in Ubuntu on both the NUC9i9QNX and NUC7i7DNHE:
As the read speeds were consistently slower on the NUC9i9QNX I raised a support ticket with Intel. Their initial response was not promising as after asking for more information and to run Intel’s System Support Utility for Windows they responded with:
I am writing to let you know that according to the information provided, the Configured Clock Speed (3200 MHz) that is used is not supported for this model.
Please check the proper memory specifications here. ( Memory Types DDR4-2666 ).
https://ark.intel.com/content/www/us/en/ark/products/190107/intel-nuc-9-extreme-kit-nuc9i9qnx.html
This actually highlights another issue as when I was first diagnosing the M.2 speed issue the memory was only running at 2666 MHz by default and there was no XMP setting in the original BIOS (version 34):
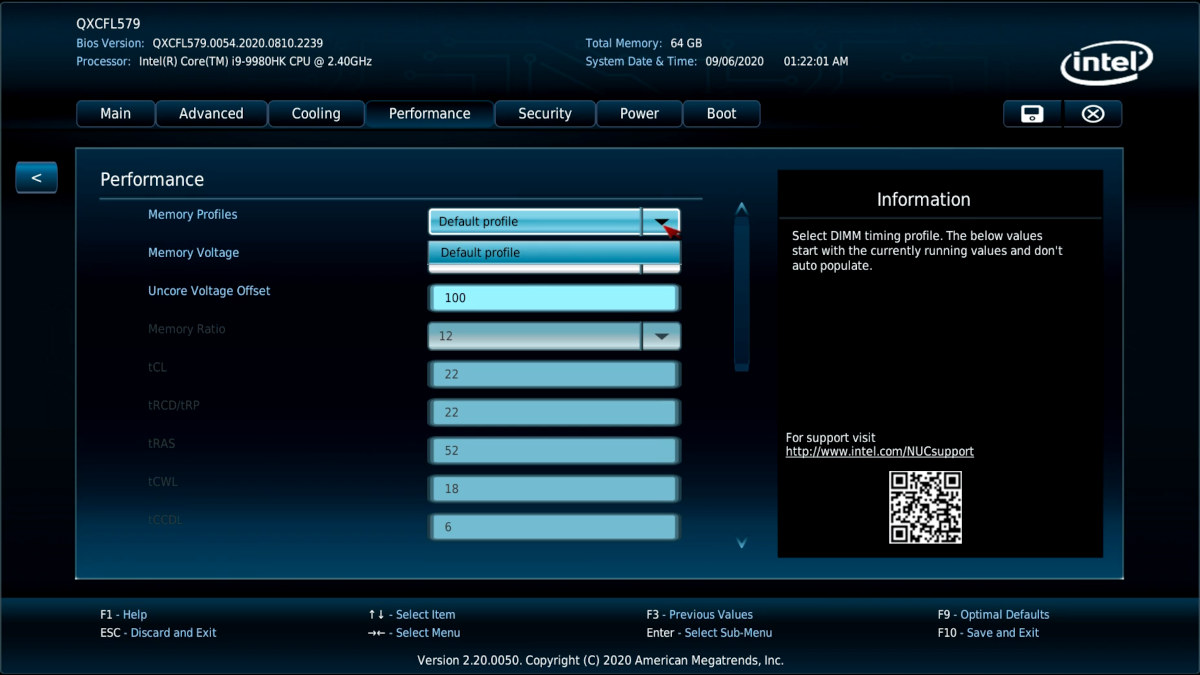
I had then subsequently updated the BIOS to the latest version 54 in the hope it would fix the M.2 issue which it didn’t. It did however automatically set the speed of the memory to 3200 MHz although there was still no setting in the BIOS to manually change the speed or set XMP:
Ironically Intel also provided a link so I could “Find Compatible Components for this NUC” which actually shows several memory entries with speeds of 3200 MHz as being “Intel validated”:
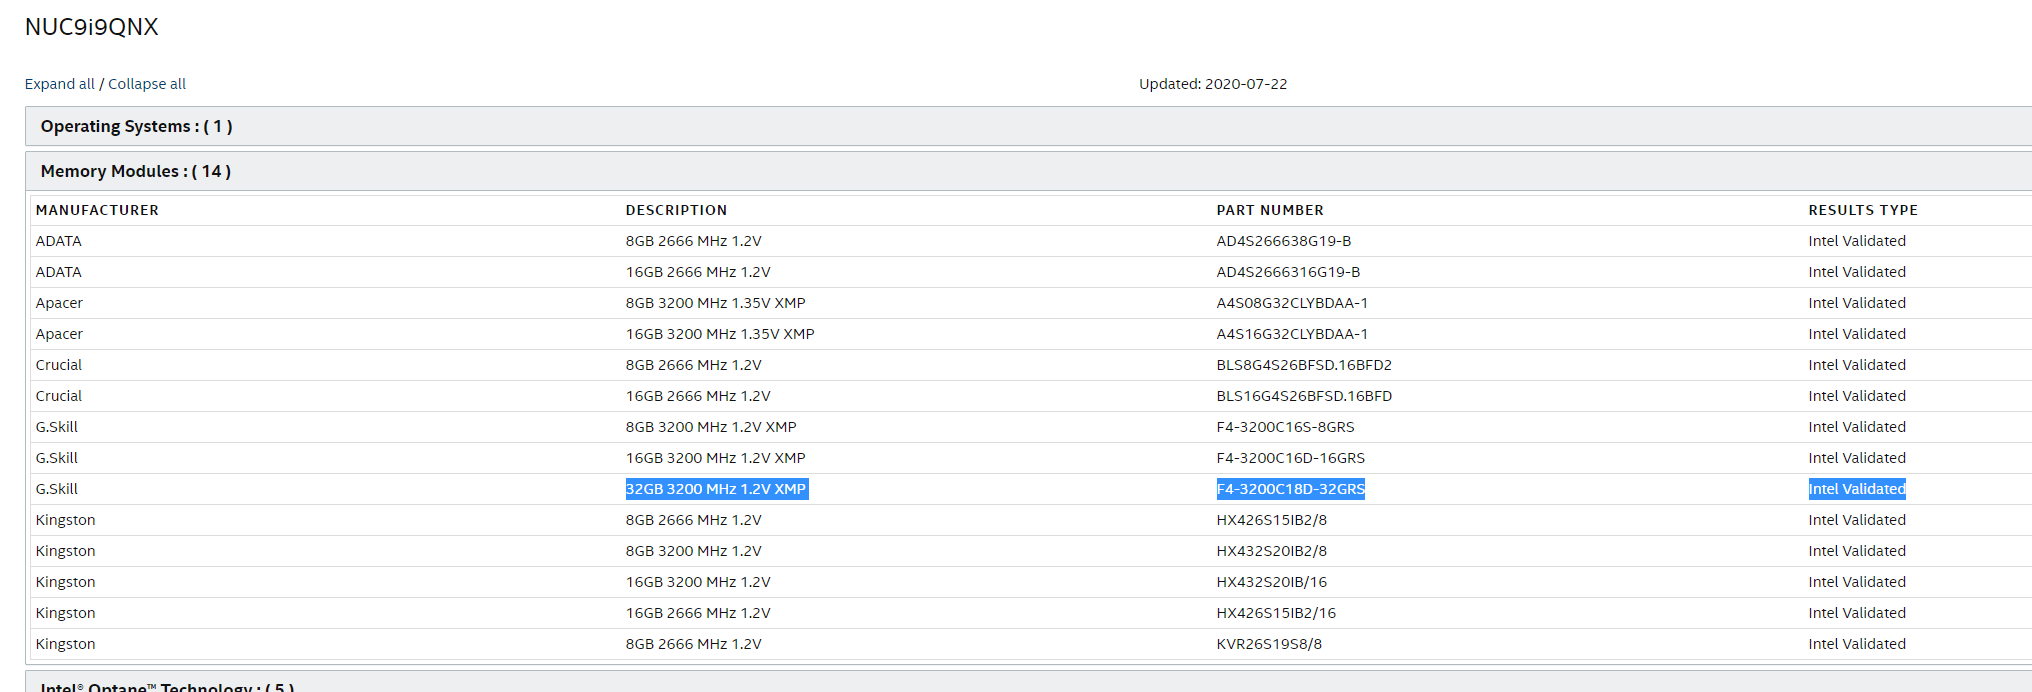
which seemed to contradict their statement. Furthermore, I had only purchased the memory having consulted this page prior to ordering the NUC9i9QNX in the first place.
So I replaced the memory with two sticks of 8GB SODIMM DDR4 2666 MHz which unsurprisingly didn’t fix the issue and as a result, Intel treated the ticket as a warranty issue. After I shipped the NUC9i9QNX to them in Malaysia using their pre-paid DHL service I received a full refund which I used to buy the replacement NUC used in the testing above. And yes, the NVMe speeds are still the same indicating there is a more fundamental problem perhaps likely to be a BIOS related issue. For those interested the whole refund process took nearly a month however Intel were very responsive throughout with daily updates. Now back to the rest of the performance metrics.
For my specific set of Phoronix Test Suite tests the results were:

It is interesting to compare these results against the two Intel Gemini Lake NUCs and the AMD Ryzen 5 Beelink GT-R as these are indicative of the performance from recent mini PCs and it shows how far off they are in terms of performance from the significantly more powerful NUC9i9QNX.
NUC9i9QNX Performance in Ubuntu
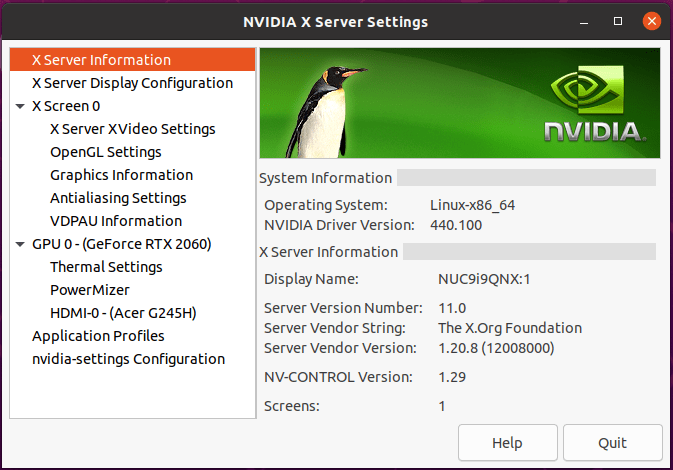
After shrinking the Windows partition in half and creating a new partition I installed Ubuntu using an Ubuntu 20.04 ISO as dual boot. After installation and updates, the key hardware information is as follows: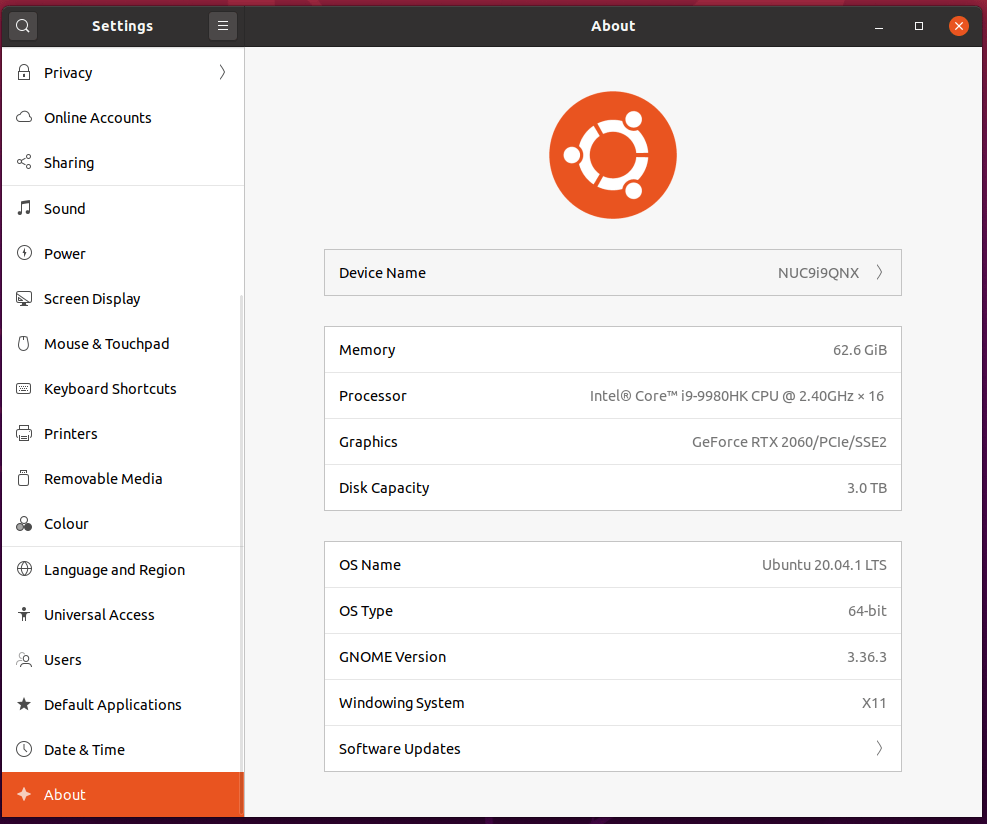
|
1 2 3 4 5 6 7 8 9 10 11 12 13 14 15 16 17 18 19 20 21 22 23 24 25 26 27 28 29 30 31 32 33 34 35 36 37 38 39 40 41 42 43 44 45 46 47 48 49 50 51 52 53 54 55 56 57 58 59 60 61 62 63 64 65 66 67 68 69 70 71 72 73 74 75 76 77 78 79 80 81 82 83 84 85 86 87 88 89 90 91 92 93 94 95 96 97 98 99 100 101 102 103 104 105 106 107 108 109 110 111 112 113 114 115 116 117 118 119 120 121 122 123 124 125 126 127 128 129 130 131 132 133 134 135 136 137 138 139 140 141 142 143 144 145 146 147 148 149 150 151 152 153 154 155 156 157 158 159 160 161 162 163 164 165 166 167 168 169 170 171 172 173 174 175 176 177 178 179 180 181 182 183 184 185 186 187 188 189 190 191 192 193 194 195 196 197 198 199 200 201 202 203 204 205 206 207 208 209 210 211 212 213 214 215 216 217 218 219 220 221 222 223 224 225 226 227 228 229 230 231 232 233 234 235 236 237 238 239 240 241 242 243 244 245 246 247 248 249 250 251 252 253 254 255 256 257 258 259 260 261 262 263 264 265 266 267 268 269 270 271 |
linuxium@NUC9i9QNX:~$ lsb_release -a Distributor ID: Ubuntu Description: Ubuntu 20.04.1 LTS Release: 20.04 Codename: focal linuxium@NUC9i9QNX:~$ linuxium@NUC9i9QNX:~$ uname -a Linux NUC9i9QNX 5.4.0-45-generic #49-Ubuntu SMP Wed Aug 26 13:38:52 UTC 2020 x86_64 x86_64 x86_64 GNU/Linux linuxium@NUC9i9QNX:~$ linuxium@NUC9i9QNX:~$ inxi -Fc0 System: Host: NUC9i9QNX Kernel: 5.4.0-45-generic x86_64 bits: 64 Desktop: Gnome 3.36.4 Distro: Ubuntu 20.04.1 LTS (Focal Fossa) Machine: Type: Mini-pc System: Intel Client Systems product: NUC9i9QNX v: K49242-402 serial: XXXXXXXXXXXX Mobo: Intel model: NUC9i9QNB v: K49243-402 serial: XXXXXXXXXXXX UEFI: Intel v: QXCFL579.0054.2020.0810.2239 date: 08/10/2020 CPU: Topology: 8-Core model: Intel Core i9-9980HK bits: 64 type: MT MCP L2 cache: 16.0 MiB Speed: 4865 MHz min/max: 800/5000 MHz Core speeds (MHz): 1: 4850 2: 4893 3: 4973 4: 4896 5: 4914 6: 4834 7: 4913 8: 4841 9: 4869 10: 4914 11: 4877 12: 4831 13: 4921 14: 4857 15: 4898 16: 4830 Graphics: Device-1: NVIDIA TU104 [GeForce RTX 2060] driver: nvidia v: 440.100 Display: server: X.Org 1.20.8 driver: nvidia unloaded: fbdev,modesetting,nouveau,vesa resolution: 1920x1080~60Hz OpenGL: renderer: GeForce RTX 2060/PCIe/SSE2 v: 4.6.0 NVIDIA 440.100 Audio: Device-1: Intel Cannon Lake PCH cAVS driver: snd_hda_intel Device-2: NVIDIA TU104 HD Audio driver: snd_hda_intel Sound Server: ALSA v: k5.4.0-45-generic Network: Device-1: Intel Ethernet I219-LM driver: e1000e IF: eno1 state: up speed: 1000 Mbps duplex: full mac: xx:xx:xx:xx:xx:xx Device-2: Intel Wi-Fi 6 AX200 driver: iwlwifi IF: wlp3s0 state: down mac: xx:xx:xx:xx:xx:xx Device-3: Intel I210 Gigabit Network driver: igb IF: enp112s0 state: down mac: xx:xx:xx:xx:xx:xx Drives: Local Storage: total: 1.86 TiB used: 259.69 GiB (13.6%) ID-1: /dev/nvme0n1 vendor: A-Data model: SX8200PNP size: 1.86 TiB ID-2: /dev/nvme1n1 vendor: Samsung model: SSD 970 EVO 1TB size: 931.51 GiB Partition: ID-1: / size: 937.88 GiB used: 259.66 GiB (27.7%) fs: ext4 dev: /dev/nvme0n1p3 Sensors: System Temperatures: cpu: 41.0 C mobo: N/A gpu: nvidia temp: 36 C Fan Speeds (RPM): N/A gpu: nvidia fan: 0% Info: Processes: 389 Uptime: 8m Memory: 62.60 GiB used: 1.25 GiB (2.0%) Shell: review-tests.sh inxi: 3.0.38 linuxium@NUC9i9QNX:~$ linuxium@NUC9i9QNX:~$ df -h Filesystem Size Used Avail Use% Mounted on udev 32G 0 32G 0% /dev tmpfs 6.3G 2.2M 6.3G 1% /run /dev/nvme0n1p3 938G 260G 631G 30% / tmpfs 32G 0 32G 0% /dev/shm tmpfs 5.0M 4.0K 5.0M 1% /run/lock tmpfs 32G 0 32G 0% /sys/fs/cgroup /dev/loop0 55M 55M 0 100% /snap/core18/1880 /dev/loop1 256M 256M 0 100% /snap/gnome-3-34-1804/36 /dev/loop2 56M 56M 0 100% /snap/core18/1885 /dev/nvme1n1p1 511M 33M 479M 7% /boot/efi /dev/loop3 63M 63M 0 100% /snap/gtk-common-themes/1506 /dev/loop4 50M 50M 0 100% /snap/snap-store/467 /dev/loop5 30M 30M 0 100% /snap/snapd/8790 /dev/loop6 30M 30M 0 100% /snap/snapd/8542 tmpfs 6.3G 20K 6.3G 1% /run/user/125 tmpfs 6.3G 20K 6.3G 1% /run/user/1000 linuxium@NUC9i9QNX:~$ linuxium@NUC9i9QNX:~$ lsblk -a NAME MAJ:MIN RM SIZE RO TYPE MOUNTPOINT loop0 7:0 0 55M 1 loop /snap/core18/1880 loop1 7:1 0 255.6M 1 loop /snap/gnome-3-34-1804/36 loop2 7:2 0 55.3M 1 loop /snap/core18/1885 loop3 7:3 0 62.1M 1 loop /snap/gtk-common-themes/1506 loop4 7:4 0 49.8M 1 loop /snap/snap-store/467 loop5 7:5 0 29.9M 1 loop /snap/snapd/8790 loop6 7:6 0 29.9M 1 loop /snap/snapd/8542 loop7 7:7 0 0 loop sda 8:0 1 0 disk nvme0n1 259:0 0 1.9T 0 disk ├─nvme0n1p1 259:1 0 16M 0 part ├─nvme0n1p2 259:2 0 953.9G 0 part └─nvme0n1p3 259:3 0 953.9G 0 part / nvme1n1 259:4 0 931.5G 0 disk ├─nvme1n1p1 259:5 0 512M 0 part /boot/efi └─nvme1n1p2 259:6 0 931G 0 part linuxium@NUC9i9QNX:~$ linuxium@NUC9i9QNX:~$ sudo lshw -C cpu *-cpu description: CPU product: Intel(R) Core(TM) i9-9980HK CPU @ 2.40GHz vendor: Intel Corp. physical id: 36 bus info: cpu@0 version: Intel(R) Core(TM) i9-9980HK CPU @ 2.40GHz serial: To Be Filled By O.E.M. slot: U3E1 size: 4938MHz capacity: 5GHz width: 64 bits clock: 100MHz capabilities: lm fpu fpu_exception wp vme de pse tsc msr pae mce cx8 apic sep mtrr pge mca cmov pat pse36 clflush dts acpi mmx fxsr sse sse2 ss ht tm pbe syscall nx pdpe1gb rdtscp x86-64 constant_tsc art arch_perfmon pebs bts rep_good nopl xtopology nonstop_tsc cpuid aperfmperf pni pclmulqdq dtes64 monitor ds_cpl vmx est tm2 ssse3 sdbg fma cx16 xtpr pdcm pcid sse4_1 sse4_2 x2apic movbe popcnt tsc_deadline_timer aes xsave avx f16c rdrand lahf_lm abm 3dnowprefetch cpuid_fault epb invpcid_single ssbd ibrs ibpb stibp ibrs_enhanced tpr_shadow vnmi flexpriority ept vpid ept_ad fsgsbase tsc_adjust bmi1 avx2 smep bmi2 erms invpcid mpx rdseed adx smap clflushopt intel_pt xsaveopt xsavec xgetbv1 xsaves dtherm ida arat pln pts hwp hwp_notify hwp_act_window hwp_epp md_clear flush_l1d arch_capabilities cpufreq configuration: cores=8 enabledcores=8 threads=16 linuxium@NUC9i9QNX:~$ linuxium@NUC9i9QNX:~$ sudo lshw -C memory *-firmware description: BIOS vendor: Intel Corp. physical id: 0 version: QXCFL579.0054.2020.0810.2239 date: 08/10/2020 size: 64KiB capacity: 16MiB capabilities: pci upgrade shadowing cdboot bootselect socketedrom edd int13floppy1200 int13floppy720 int13floppy2880 int5printscreen int14serial int17printer acpi usb biosbootspecification uefi *-memory description: System Memory physical id: 28 slot: System board or motherboard size: 64GiB *-bank:0 description: SODIMM DDR4 Synchronous 3200 MHz (0.3 ns) product: TEAMGROUP-SD4-3200 vendor: Fujitsu physical id: 0 serial: XXXXXXXX slot: ChannelA-DIMM0 size: 32GiB width: 64 bits clock: 3200MHz (0.3ns) *-bank:1 description: SODIMM DDR4 Synchronous 3200 MHz (0.3 ns) product: TEAMGROUP-SD4-3200 vendor: Fujitsu physical id: 1 serial: XXXXXXXX slot: ChannelB-DIMM0 size: 32GiB width: 64 bits clock: 3200MHz (0.3ns) *-cache:0 description: L1 cache physical id: 33 slot: L1 Cache size: 512KiB capacity: 512KiB capabilities: synchronous internal write-back unified configuration: level=1 *-cache:1 description: L2 cache physical id: 34 slot: L2 Cache size: 2MiB capacity: 2MiB capabilities: synchronous internal write-back unified configuration: level=2 *-cache:2 description: L3 cache physical id: 35 slot: L3 Cache size: 16MiB capacity: 16MiB capabilities: synchronous internal write-back unified configuration: level=3 *-memory UNCLAIMED description: RAM memory product: Cannon Lake PCH Shared SRAM vendor: Intel Corporation physical id: 14.2 bus info: pci@0000:00:14.2 version: 10 width: 64 bits clock: 33MHz (30.3ns) capabilities: pm cap_list configuration: latency=0 resources: iomemory:400-3ff iomemory:400-3ff memory:4062214000-4062215fff memory:406221b000-406221bfff linuxium@NUC9i9QNX:~$ linuxium@NUC9i9QNX:~$ free -mh total used free shared buff/cache available Mem: 62Gi 1.1Gi 60Gi 2.0Mi 708Mi 60Gi Swap: 2.0Gi 0B 2.0Gi linuxium@NUC9i9QNX:~$ linuxium@NUC9i9QNX:~$ sudo lshw -C network *-network description: Wireless interface product: Wi-Fi 6 AX200 vendor: Intel Corporation physical id: 0 bus info: pci@0000:03:00.0 logical name: wlp3s0 version: 1a serial: xx:xx:xx:xx:xx:xx width: 64 bits clock: 33MHz capabilities: pm msi pciexpress msix bus_master cap_list ethernet physical wireless configuration: broadcast=yes driver=iwlwifi driverversion=5.4.0-45-generic firmware=48.4fa0041f.0 latency=0 link=no multicast=yes wireless=IEEE 802.11 resources: irq:16 memory:6c400000-6c403fff *-network description: Ethernet interface product: I210 Gigabit Network Connection vendor: Intel Corporation physical id: 0 bus info: pci@0000:70:00.0 logical name: enp112s0 version: 03 serial: xx:xx:xx:xx:xx:xx capacity: 1Gbit/s width: 32 bits clock: 33MHz capabilities: pm msi msix pciexpress bus_master cap_list ethernet physical tp 10bt 10bt-fd 100bt 100bt-fd 1000bt-fd autonegotiation configuration: autonegotiation=on broadcast=yes driver=igb driverversion=5.6.0-k firmware=3.25, 0x800005d0 latency=0 link=no multicast=yes port=twisted pair resources: irq:17 memory:6c200000-6c27ffff ioport:3000(size=32) memory:6c280000-6c283fff *-network description: Ethernet interface product: Ethernet Connection (7) I219-LM vendor: Intel Corporation physical id: 1f.6 bus info: pci@0000:00:1f.6 logical name: eno1 version: 10 serial: xx:xx:xx:xx:xx:xx size: 1Gbit/s capacity: 1Gbit/s width: 32 bits clock: 33MHz capabilities: pm msi bus_master cap_list ethernet physical tp 10bt 10bt-fd 100bt 100bt-fd 1000bt-fd autonegotiation configuration: autonegotiation=on broadcast=yes driver=e1000e driverversion=3.2.6-k duplex=full firmware=0.5-4 ip=xxx.xxx.xxx.xxx latency=0 link=yes multicast=yes port=twisted pair speed=1Gbit/s resources: irq:152 memory:6a100000-6a11ffff linuxium@NUC9i9QNX:~$ linuxium@NUC9i9QNX:~$ dmesg | grep "MMC card" linuxium@NUC9i9QNX:~$ linuxium@NUC9i9QNX:~$ lsusb Bus 006 Device 001: ID 1d6b:0003 Linux Foundation 3.0 root hub Bus 005 Device 001: ID 1d6b:0002 Linux Foundation 2.0 root hub Bus 002 Device 003: ID 05e3:0754 Genesys Logic, Inc. USB Storage Bus 002 Device 002: ID 05e3:0625 Genesys Logic, Inc. USB3.2 Hub Bus 002 Device 001: ID 1d6b:0003 Linux Foundation 3.0 root hub Bus 001 Device 007: ID 093a:2510 Pixart Imaging, Inc. Optical Mouse Bus 001 Device 005: ID 8087:0029 Intel Corp. Bus 001 Device 004: ID 05e3:0610 Genesys Logic, Inc. 4-port hub Bus 001 Device 006: ID 046d:c31c Logitech, Inc. Keyboard K120 Bus 001 Device 001: ID 1d6b:0002 Linux Foundation 2.0 root hub Bus 004 Device 001: ID 1d6b:0003 Linux Foundation 3.0 root hub Bus 003 Device 001: ID 1d6b:0002 Linux Foundation 2.0 root hub linuxium@NUC9i9QNX:~$ linuxium@NUC9i9QNX:~$ lspci -nn 00:00.0 Host bridge [0600]: Intel Corporation Device [8086:3e20] (rev 0d) 00:01.0 PCI bridge [0604]: Intel Corporation Xeon E3-1200 v5/E3-1500 v5/6th Gen Core Processor PCIe Controller (x16) [8086:1901] (rev 0d) 00:08.0 System peripheral [0880]: Intel Corporation Xeon E3-1200 v5/v6 / E3-1500 v5 / 6th/7th/8th Gen Core Processor Gaussian Mixture Model [8086:1911] 00:12.0 Signal processing controller [1180]: Intel Corporation Cannon Lake PCH Thermal Controller [8086:a379] (rev 10) 00:14.0 USB controller [0c03]: Intel Corporation Cannon Lake PCH USB 3.1 xHCI Host Controller [8086:a36d] (rev 10) 00:14.2 RAM memory [0500]: Intel Corporation Cannon Lake PCH Shared SRAM [8086:a36f] (rev 10) 00:15.0 Serial bus controller [0c80]: Intel Corporation Cannon Lake PCH Serial IO I2C Controller #0 [8086:a368] (rev 10) 00:15.1 Serial bus controller [0c80]: Intel Corporation Cannon Lake PCH Serial IO I2C Controller #1 [8086:a369] (rev 10) 00:16.0 Communication controller [0780]: Intel Corporation Cannon Lake PCH HECI Controller [8086:a360] (rev 10) 00:17.0 SATA controller [0106]: Intel Corporation Cannon Lake Mobile PCH SATA AHCI Controller [8086:a353] (rev 10) 00:1b.0 PCI bridge [0604]: Intel Corporation Cannon Lake PCH PCI Express Root Port #21 [8086:a32c] (rev f0) 00:1c.0 PCI bridge [0604]: Intel Corporation Cannon Lake PCH PCI Express Root Port #1 [8086:a338] (rev f0) 00:1c.4 PCI bridge [0604]: Intel Corporation Cannon Lake PCH PCI Express Root Port #5 [8086:a33c] (rev f0) 00:1d.0 PCI bridge [0604]: Intel Corporation Cannon Lake PCH PCI Express Root Port #9 [8086:a330] (rev f0) 00:1d.5 PCI bridge [0604]: Intel Corporation Cannon Lake PCH PCI Express Root Port #14 [8086:a335] (rev f0) 00:1e.0 Communication controller [0780]: Intel Corporation Cannon Lake PCH Serial IO UART Host Controller [8086:a328] (rev 10) 00:1f.0 ISA bridge [0601]: Intel Corporation Device [8086:a30e] (rev 10) 00:1f.3 Audio device [0403]: Intel Corporation Cannon Lake PCH cAVS [8086:a348] (rev 10) 00:1f.4 SMBus [0c05]: Intel Corporation Cannon Lake PCH SMBus Controller [8086:a323] (rev 10) 00:1f.5 Serial bus controller [0c80]: Intel Corporation Cannon Lake PCH SPI Controller [8086:a324] (rev 10) 00:1f.6 Ethernet controller [0200]: Intel Corporation Ethernet Connection (7) I219-LM [8086:15bb] (rev 10) 01:00.0 VGA compatible controller [0300]: NVIDIA Corporation TU104 [GeForce RTX 2060] [10de:1e89] (rev a1) 01:00.1 Audio device [0403]: NVIDIA Corporation TU104 HD Audio Controller [10de:10f8] (rev a1) 01:00.2 USB controller [0c03]: NVIDIA Corporation TU104 USB 3.1 Host Controller [10de:1ad8] (rev a1) 01:00.3 Serial bus controller [0c80]: NVIDIA Corporation TU104 USB Type-C UCSI Controller [10de:1ad9] (rev a1) 02:00.0 Non-Volatile memory controller [0108]: ADATA Technology Co., Ltd. XPG SX8200 Pro PCIe Gen3x4 M.2 2280 Solid State Drive [1cc1:8201] (rev 03) 03:00.0 Network controller [0280]: Intel Corporation Wi-Fi 6 AX200 [8086:2723] (rev 1a) 04:00.0 PCI bridge [0604]: Intel Corporation JHL7540 Thunderbolt 3 Bridge [Titan Ridge 4C 2018] [8086:15ea] (rev 06) 05:00.0 PCI bridge [0604]: Intel Corporation JHL7540 Thunderbolt 3 Bridge [Titan Ridge 4C 2018] [8086:15ea] (rev 06) 05:01.0 PCI bridge [0604]: Intel Corporation JHL7540 Thunderbolt 3 Bridge [Titan Ridge 4C 2018] [8086:15ea] (rev 06) 05:02.0 PCI bridge [0604]: Intel Corporation JHL7540 Thunderbolt 3 Bridge [Titan Ridge 4C 2018] [8086:15ea] (rev 06) 05:04.0 PCI bridge [0604]: Intel Corporation JHL7540 Thunderbolt 3 Bridge [Titan Ridge 4C 2018] [8086:15ea] (rev 06) 06:00.0 System peripheral [0880]: Intel Corporation JHL7540 Thunderbolt 3 NHI [Titan Ridge 4C 2018] [8086:15eb] (rev 06) 3a:00.0 USB controller [0c03]: Intel Corporation JHL7540 Thunderbolt 3 USB Controller [Titan Ridge 4C 2018] [8086:15ec] (rev 06) 6f:00.0 Non-Volatile memory controller [0108]: Samsung Electronics Co Ltd NVMe SSD Controller SM981/PM981/PM983 [144d:a808] 70:00.0 Ethernet controller [0200]: Intel Corporation I210 Gigabit Network Connection [8086:1533] (rev 03) linuxium@NUC9i9QNX:~$ |
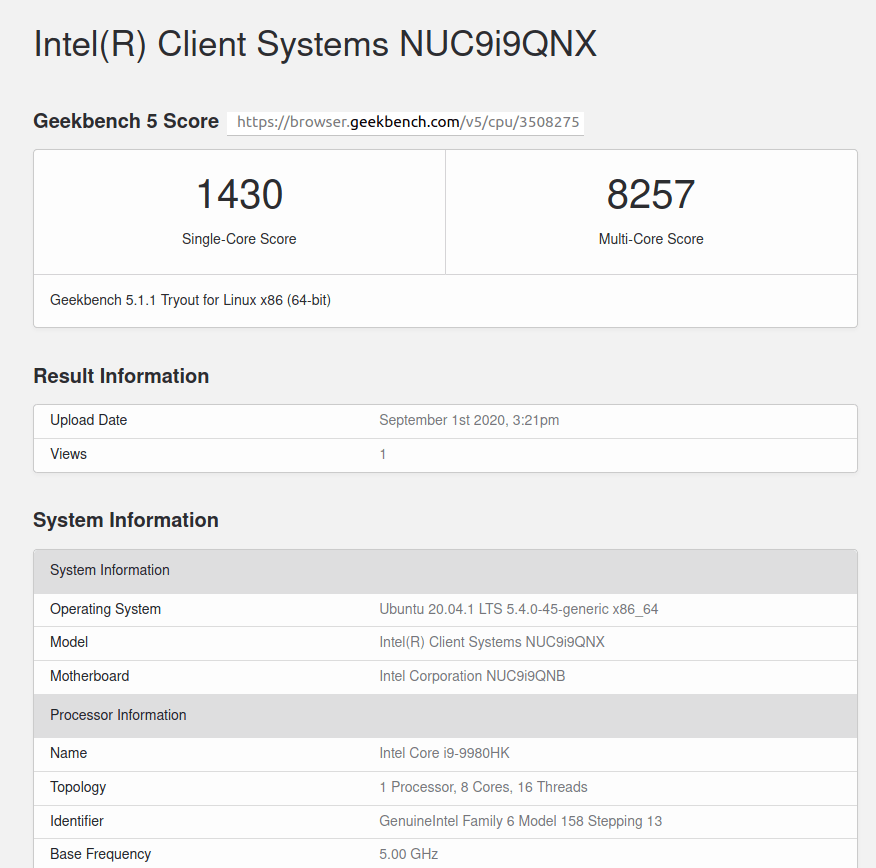
I then ran my Linux benchmarks for which the majority of the results are text-based but the graphical ones included:
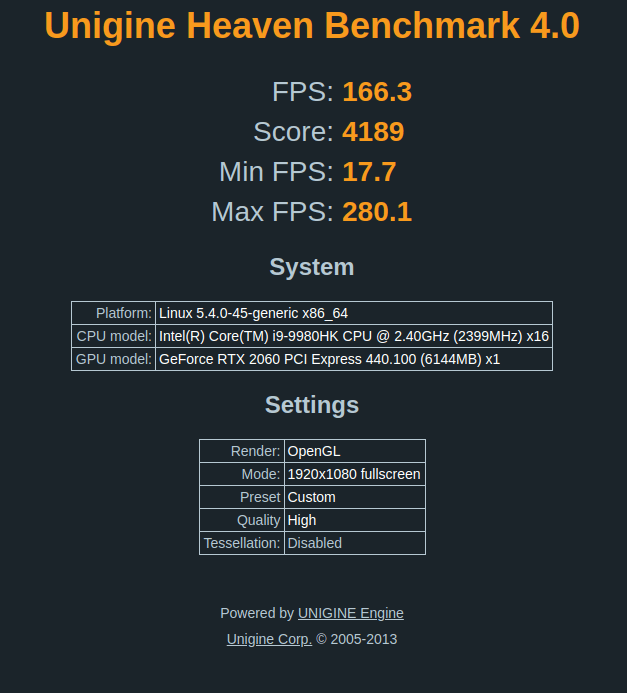
And for the same set of Phoronix Test Suite tests the results were:
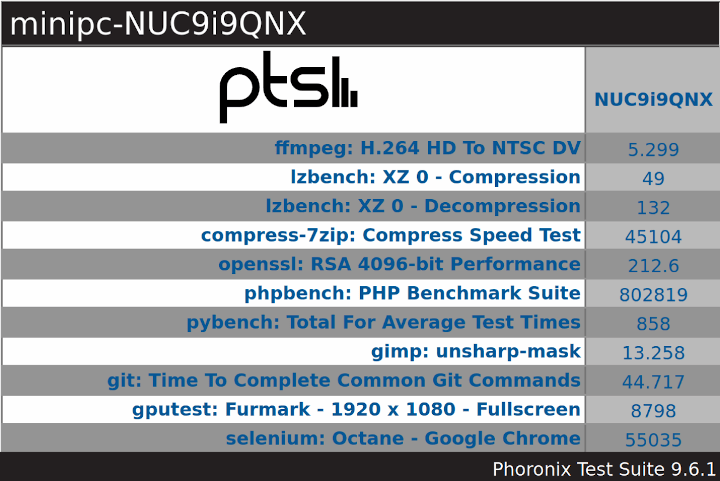
The complete results together with a similar comparison against the other mini PCs are: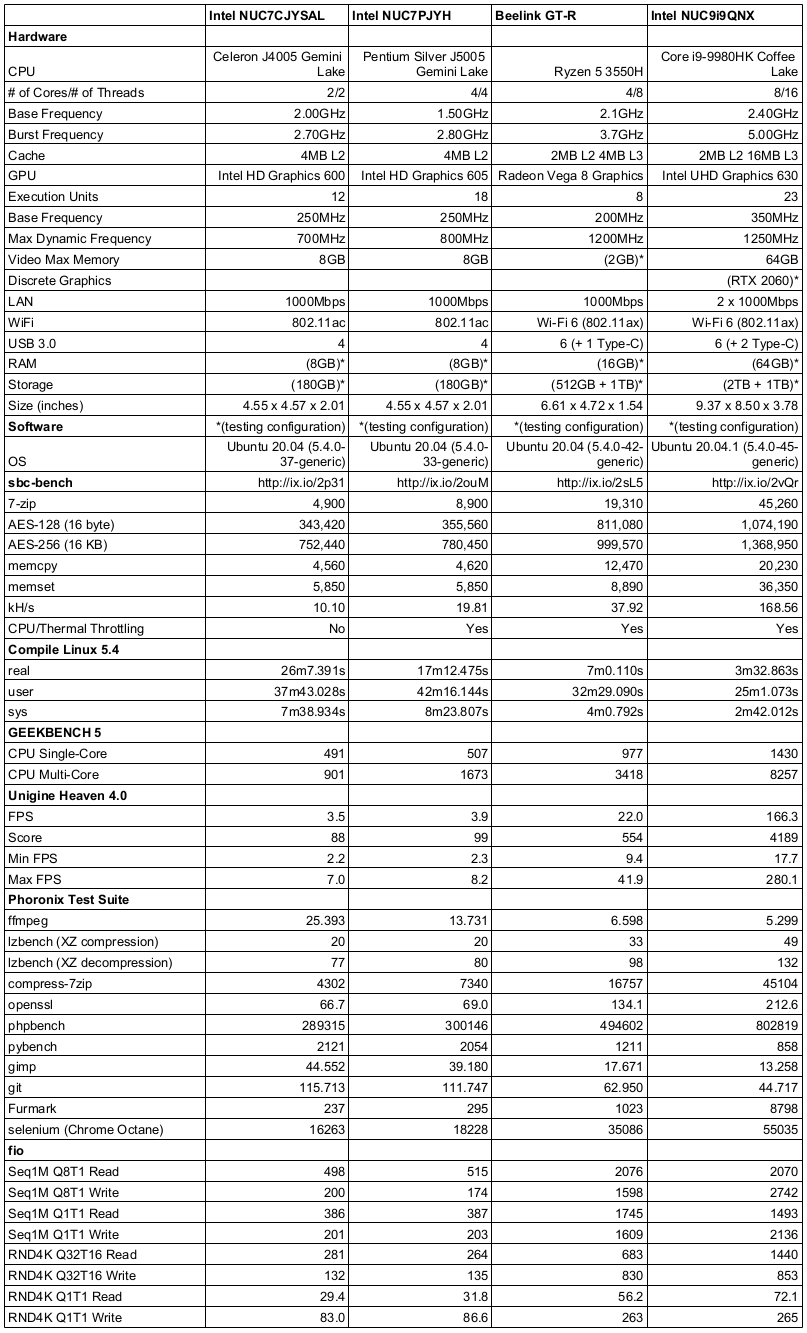
As previously noted the NVMe M.2 SSD performance is poor with a similar result to Windows.
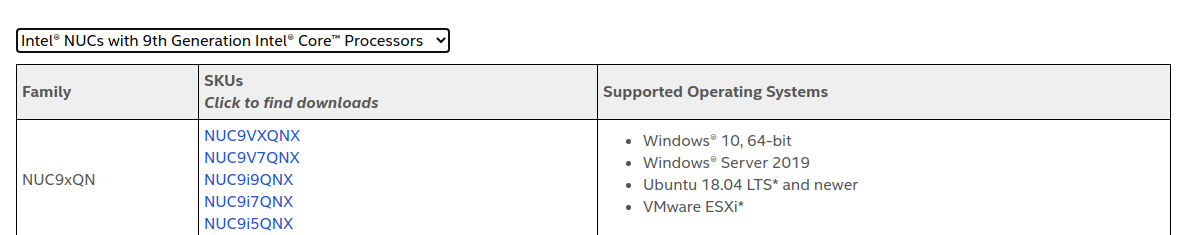
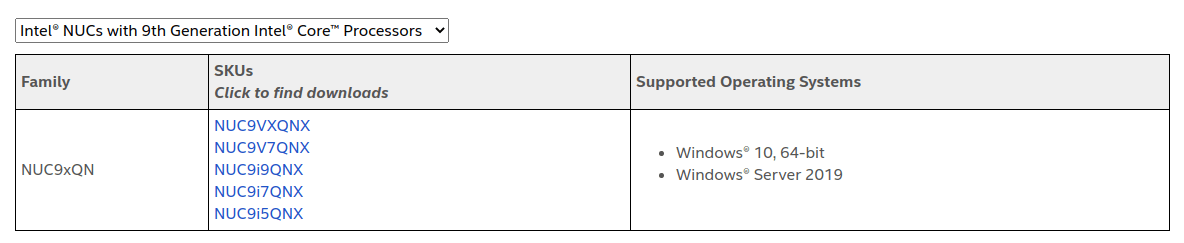
Interestingly Intel’s Supported Operating Systems for Intel NUC Products (Article ID 000005628) seems to have been updated to remove Ubuntu support for the NUC9i9QNX:
Browsers & Kodi
For real-world testing, I played some videos in Edge, Chrome, and Kodi on Windows and in Firefox, Chrome, and Kodi on Ubuntu. The following tables summarise the tests and results for each of web browsing, Kodi in general and Kodi playing specific videos:
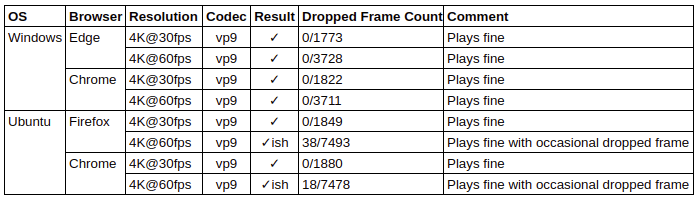
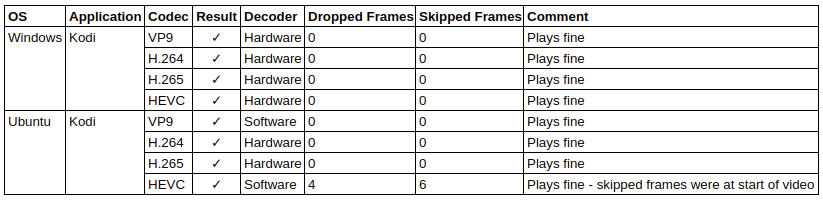
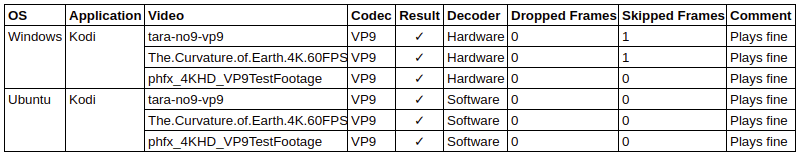
Hardware acceleration is not supported under Ubuntu for Nvidia graphics for decoding VP9 and 10-bit HEVC (H.265) which explains why software decoding was used and for the occasional skipped frames.
I also tried playing an 8K video in Kodi on both OS. In Windows there were no issues other than some initially skipped frames however with Ubuntu using software for decoding meant there were occasional frame skips:

Gaming with Intel NUC9 Kit
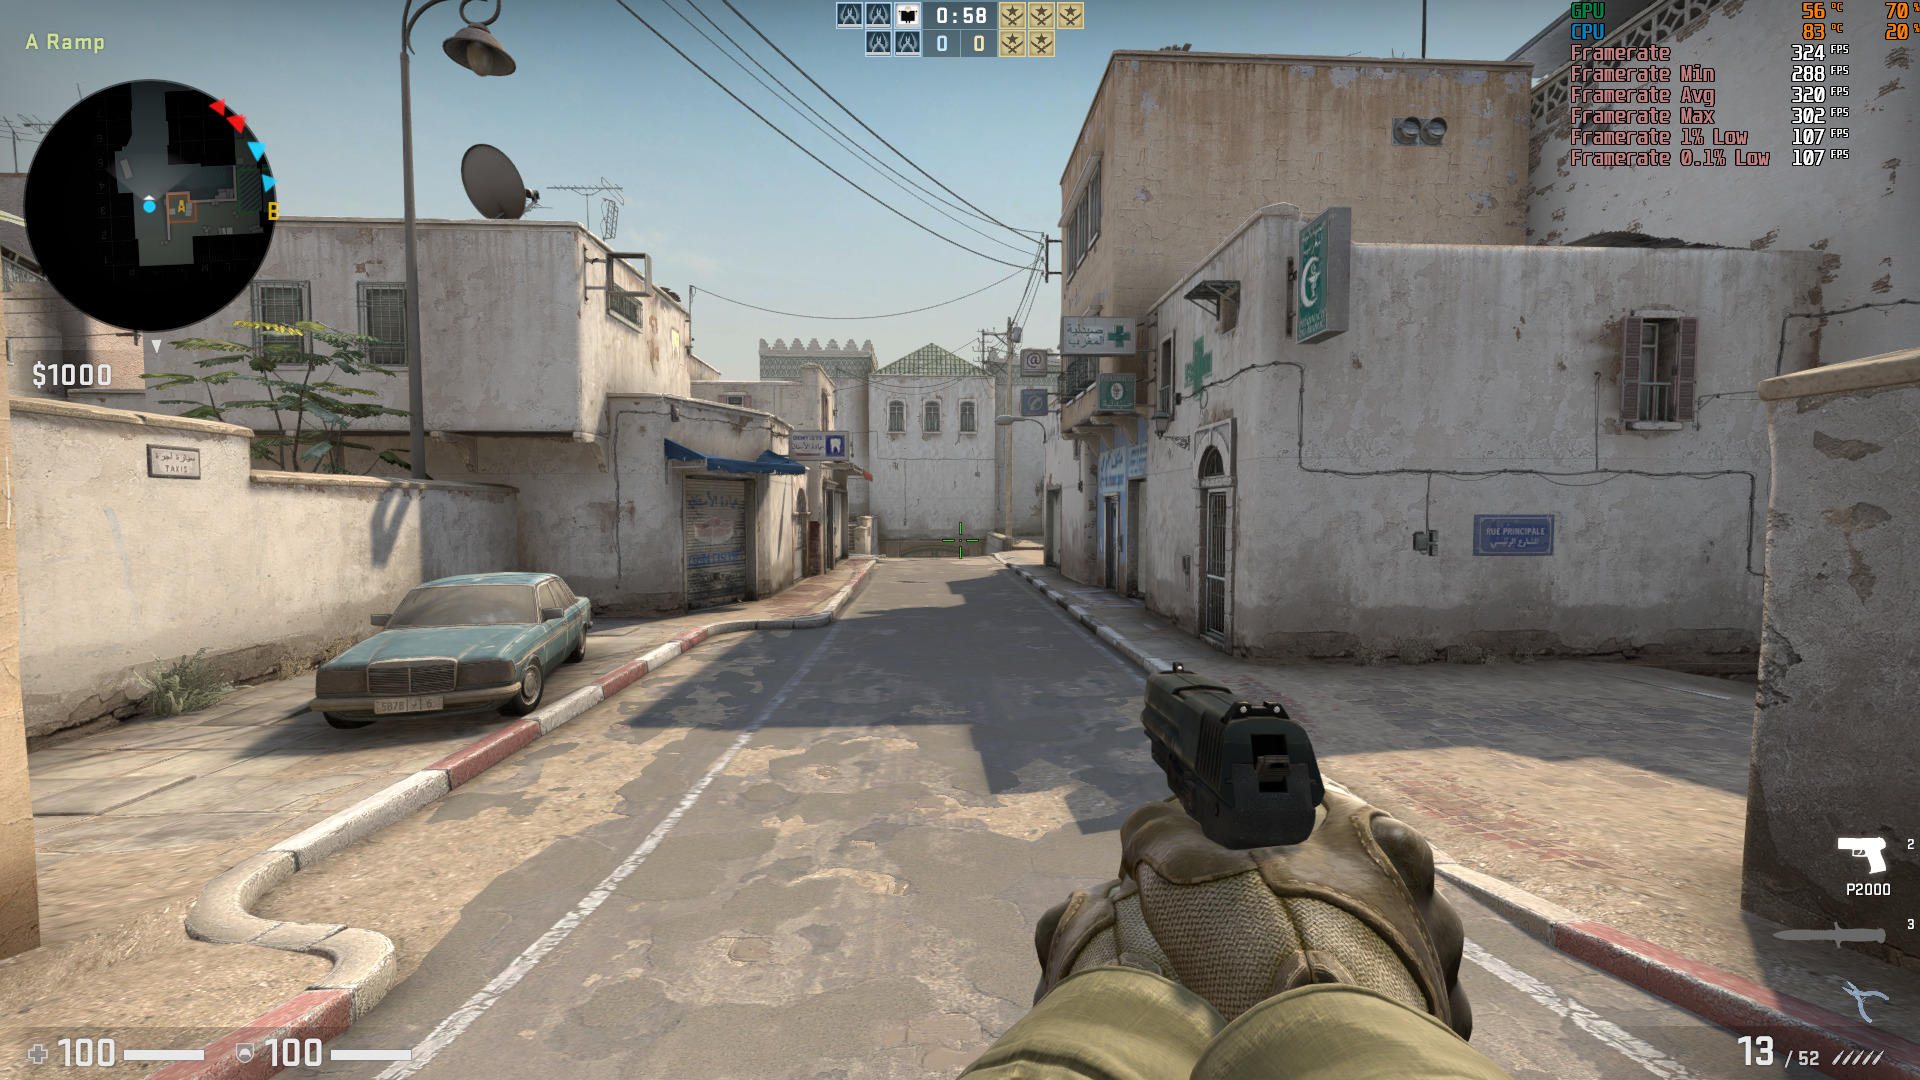
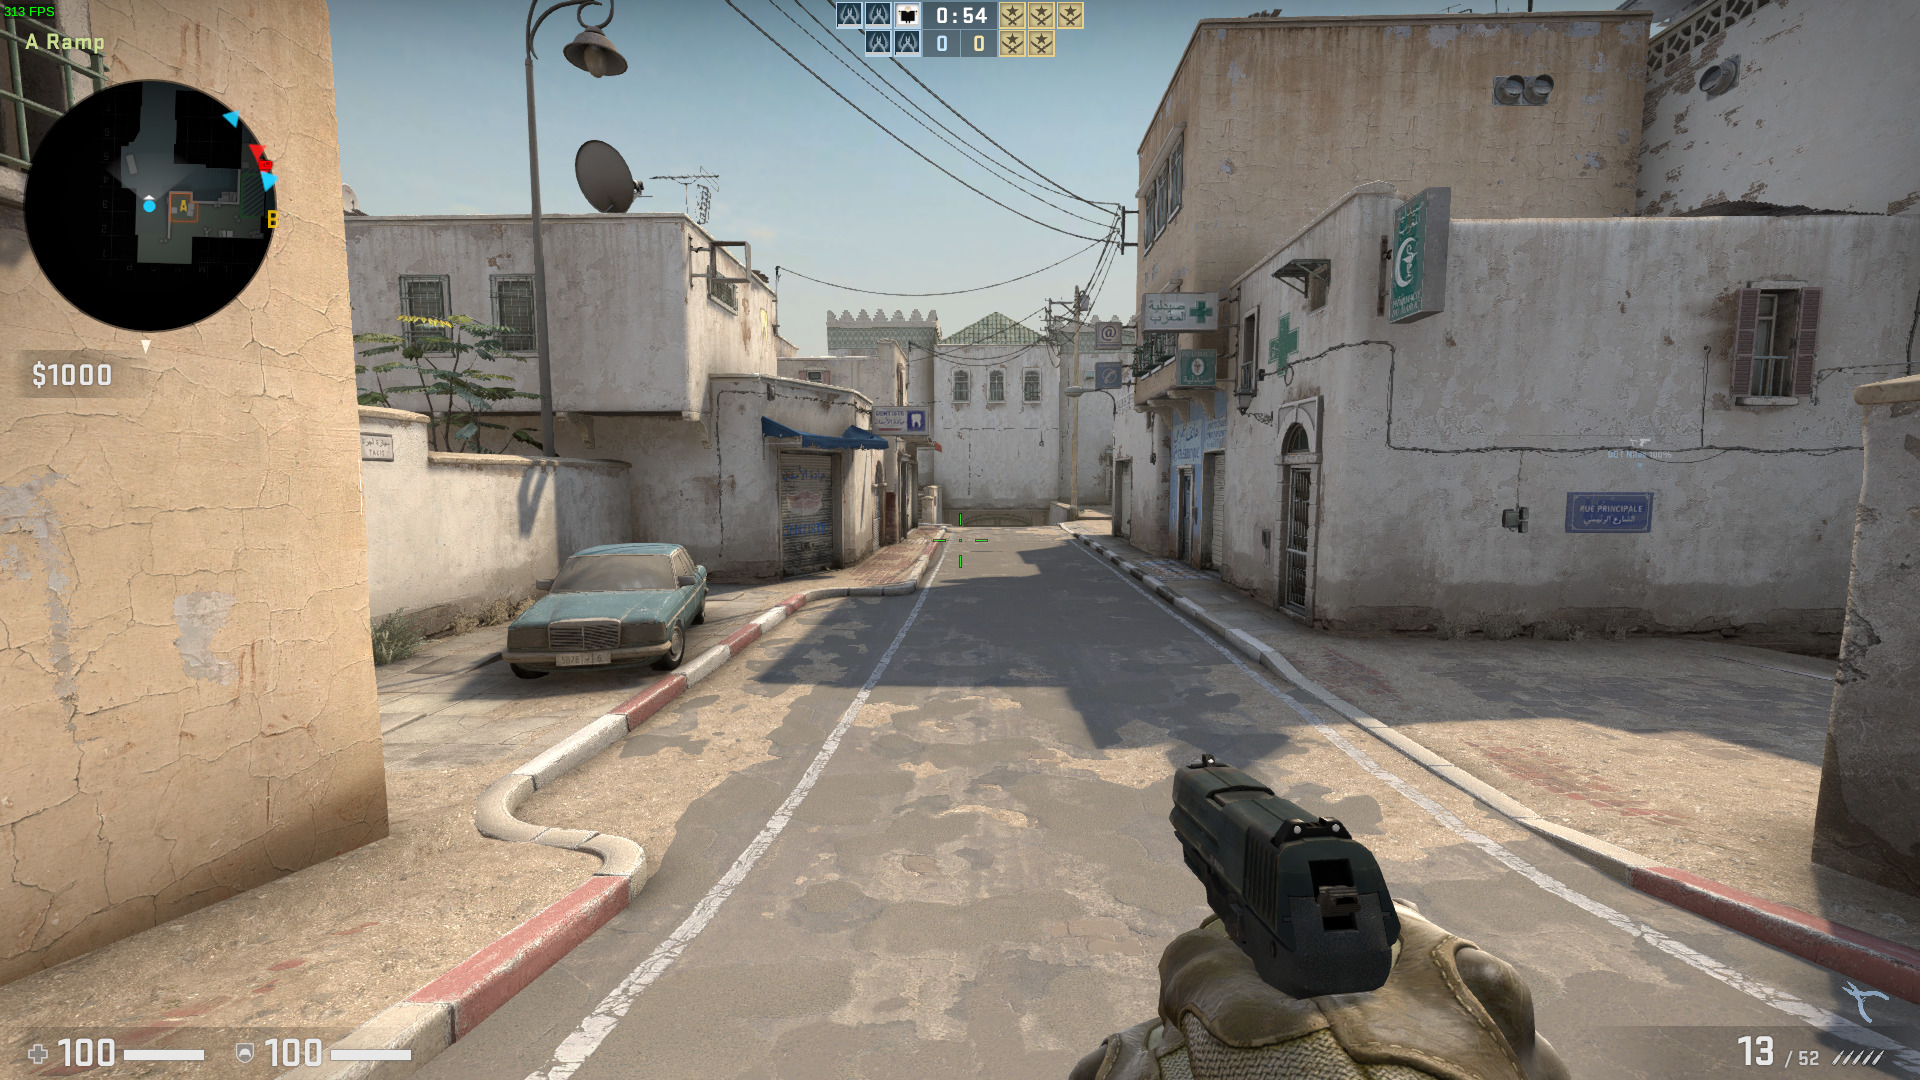
I tested three games under Steam natively in Windows and in Ubuntu using Proton 5.0 (Counter-Strike: Global Offensive, Grand Theft Auto V, and Shadow Of The Tomb Raider) at 1920×1080 resolutions using the highest settings:
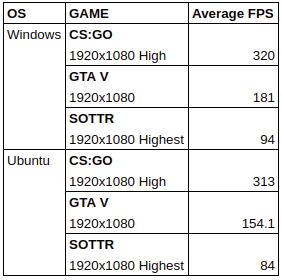
For Ubuntu I had to rely on Steam’s in-game FPS counter as I did not have tools equivalent to MSI Afterburner/Rivatuner available:
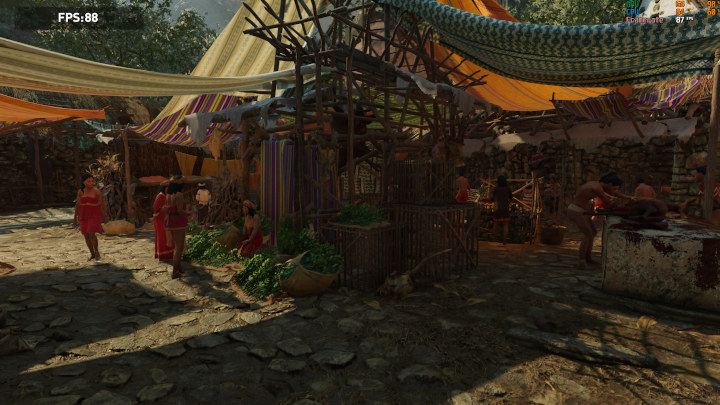
However, the results can be visually verified with the in-game benchmark from Shadow Of The Tomb Raider:
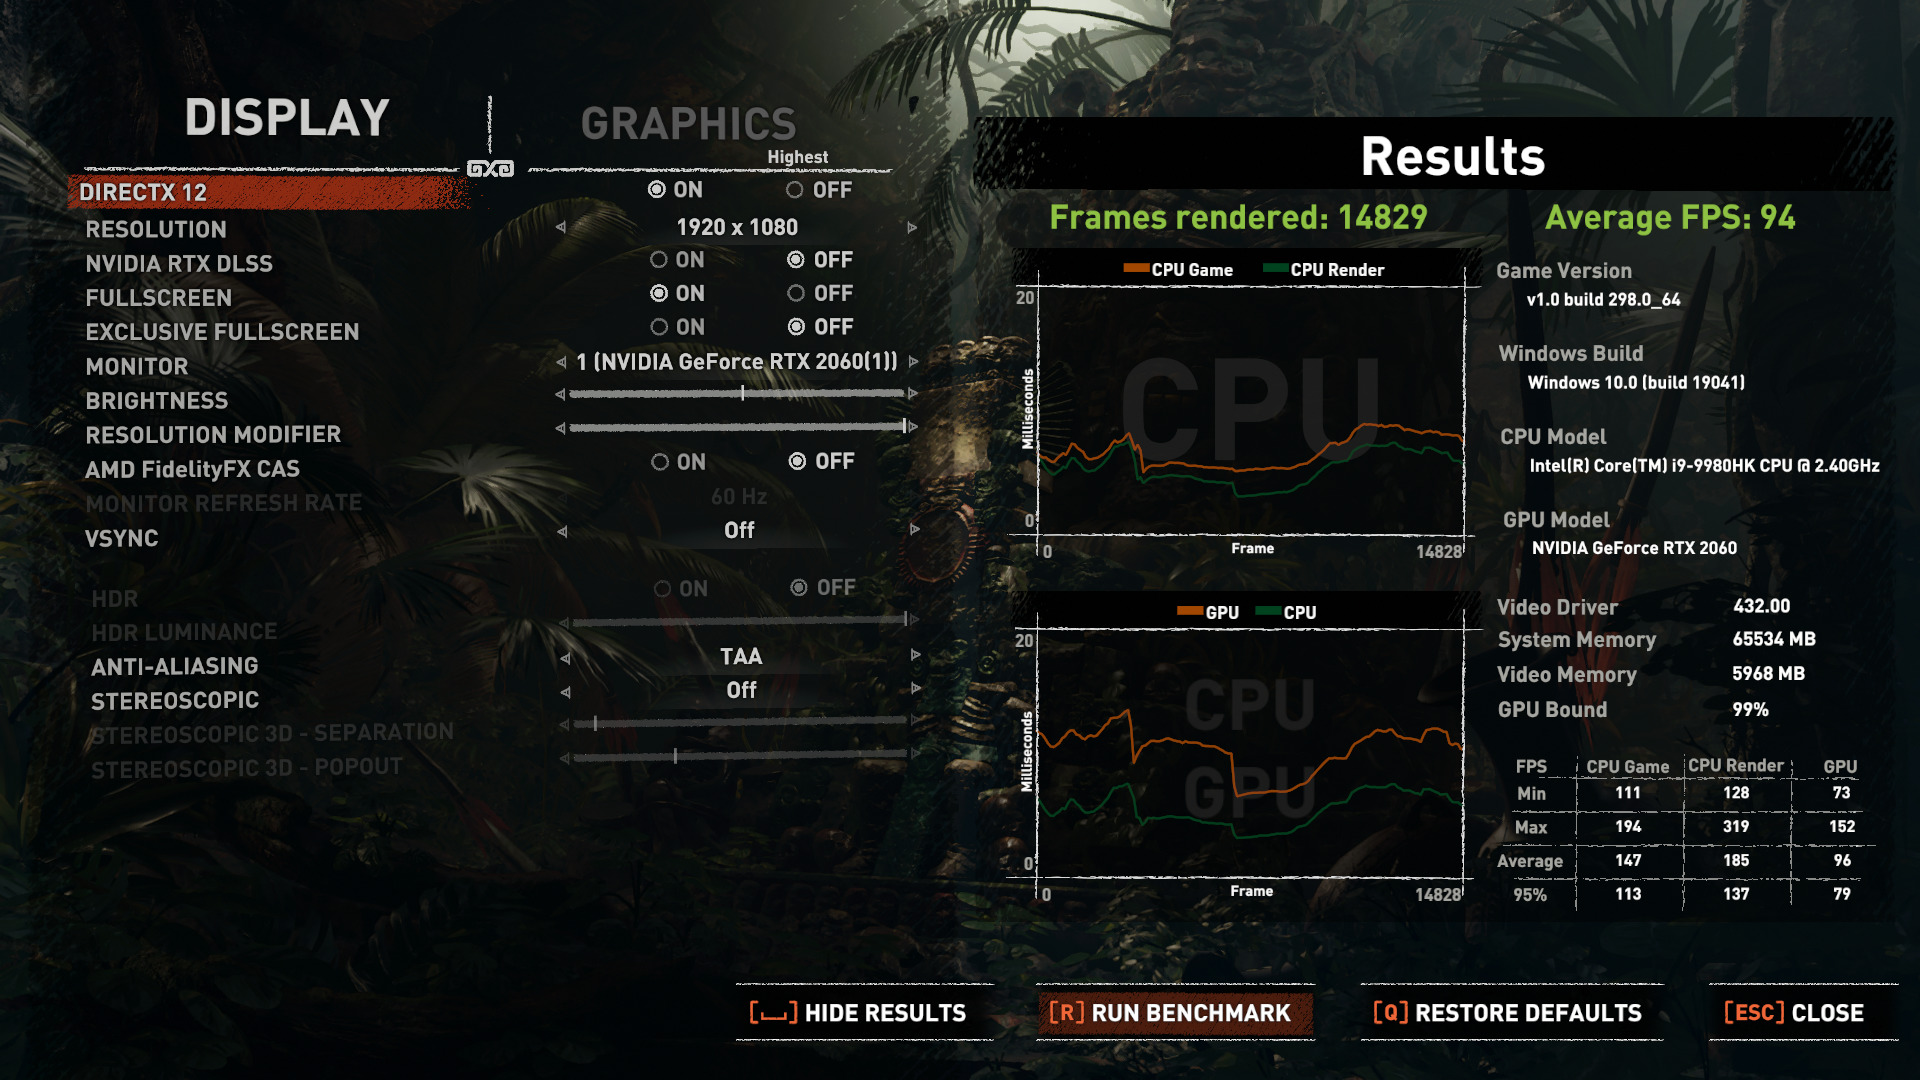
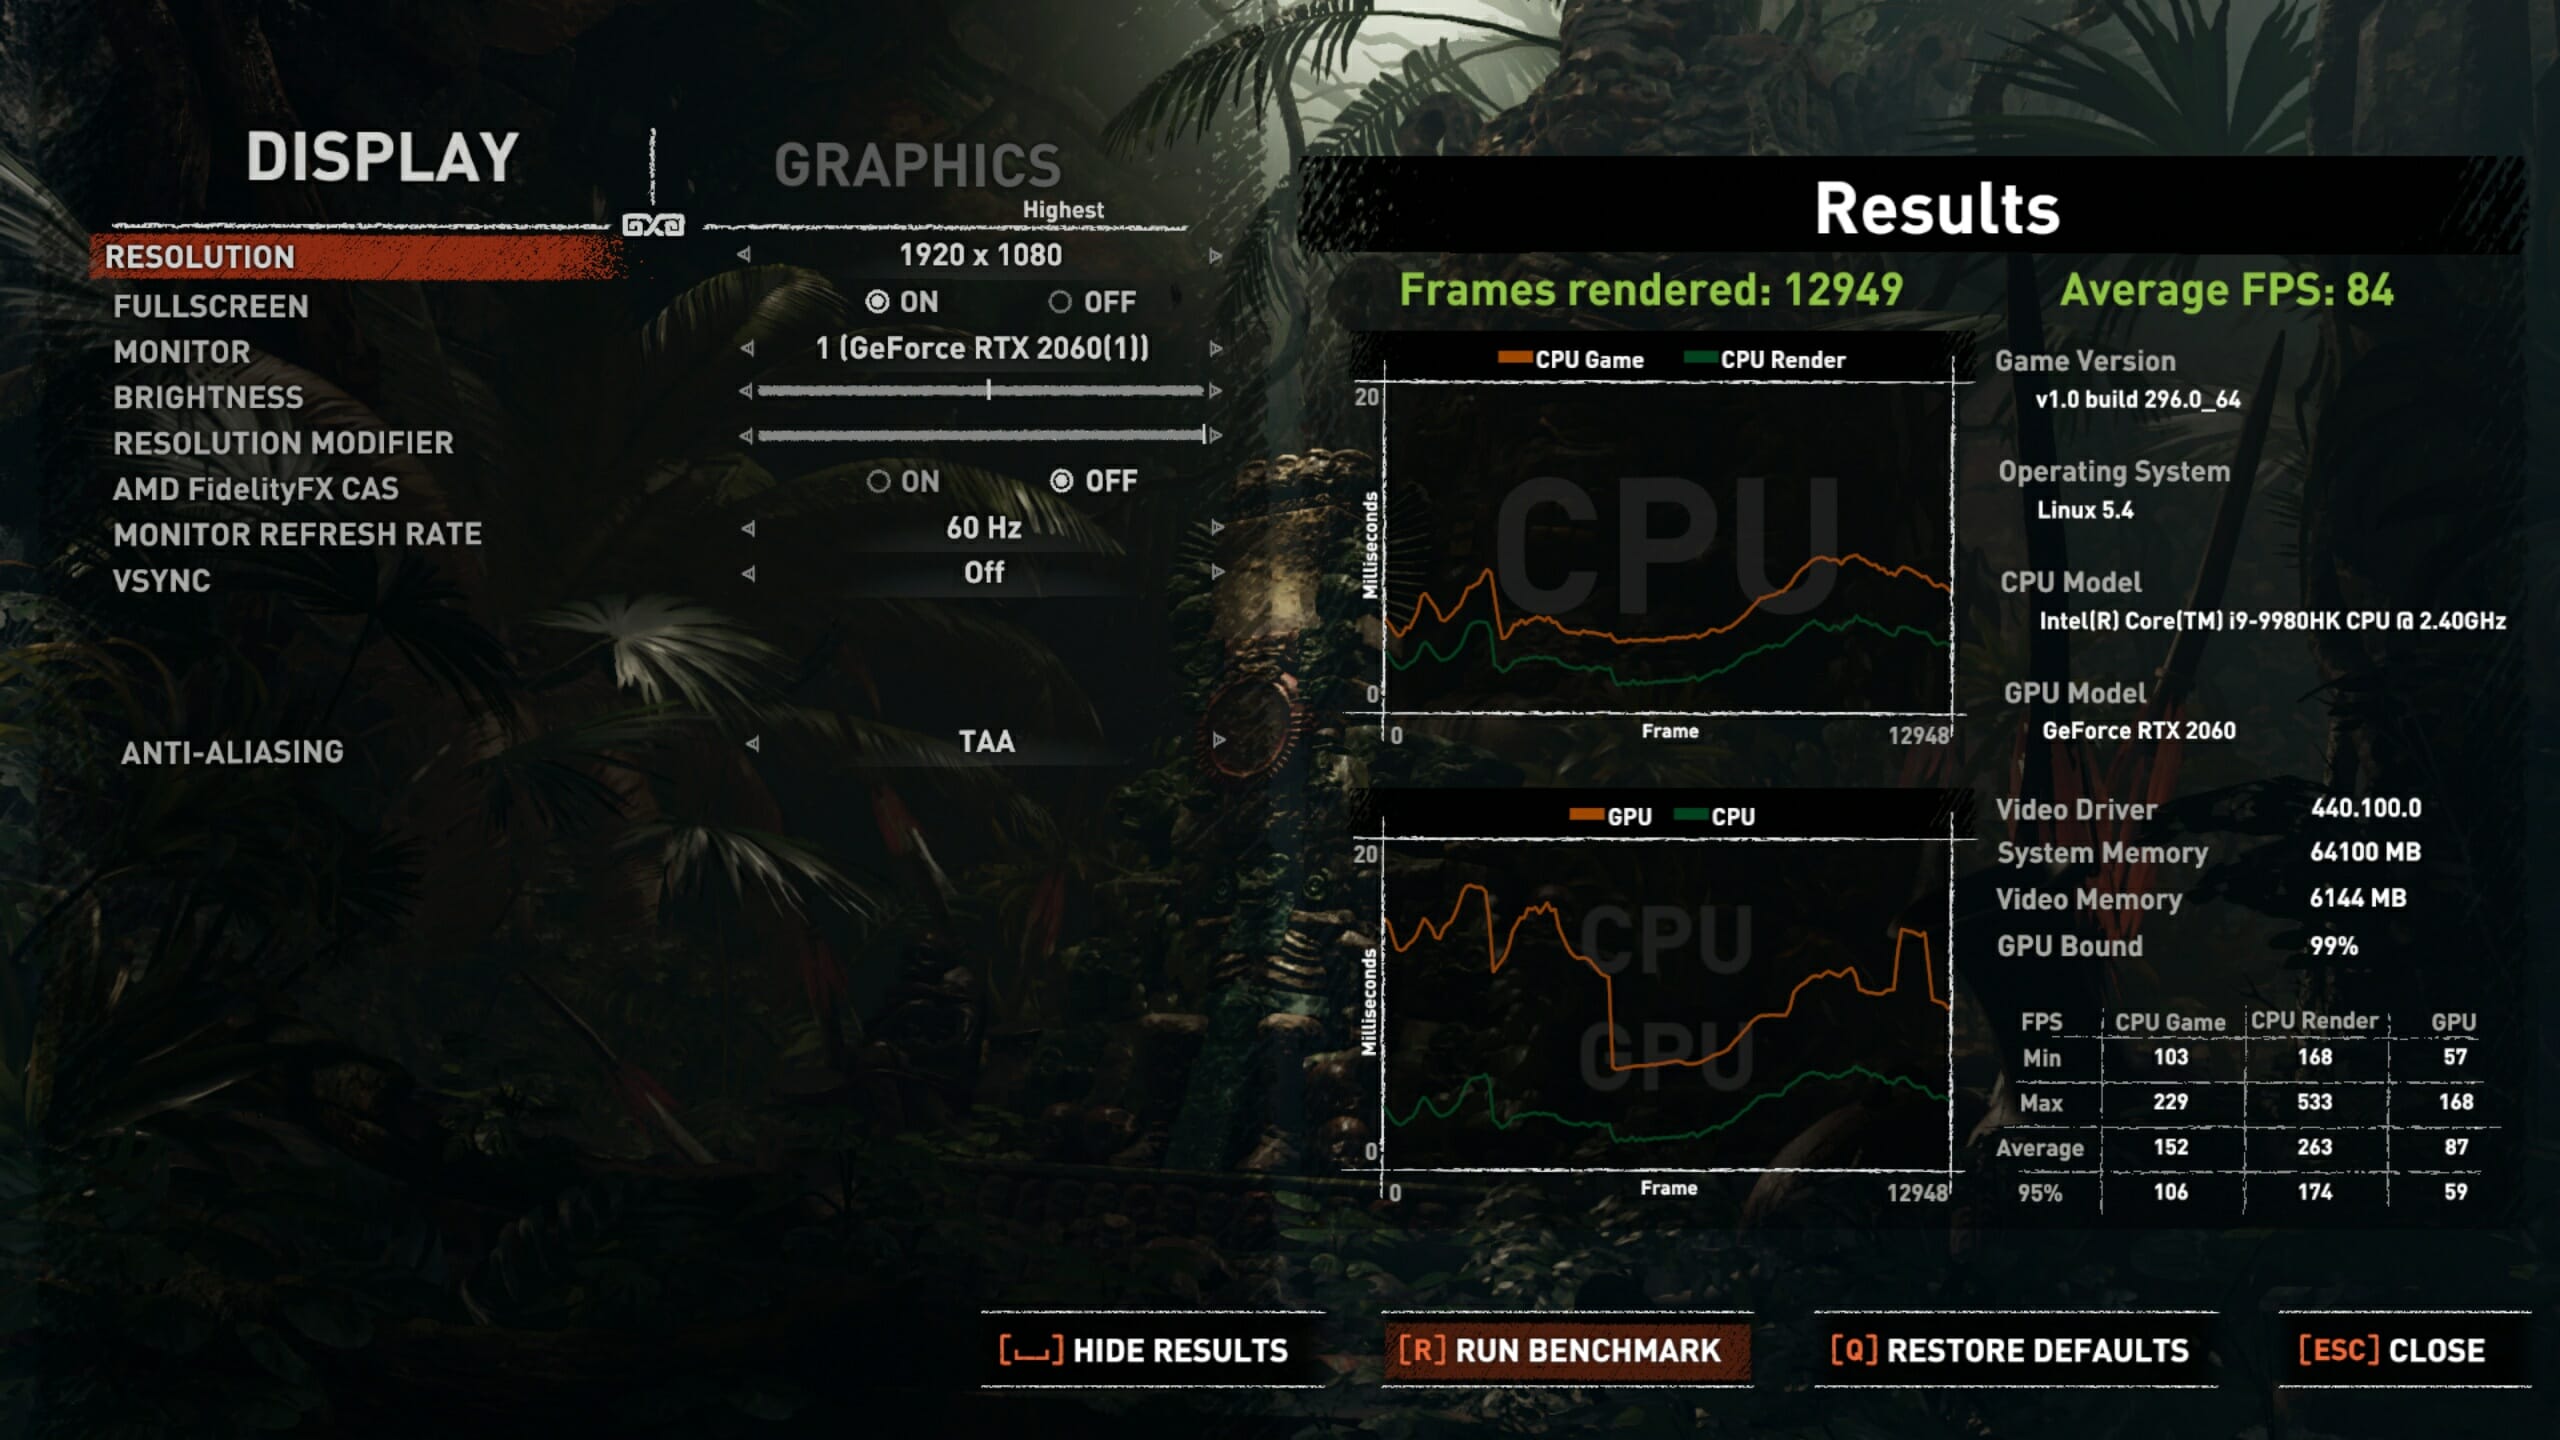
Whilst the results were similar, overall using Windows is better for gaming performance.
NUC9i9QNX Power Consumption
Power consumption was measured as follows:
- Powered off – 1.0 Watts (Windows) and 1.6 Watts (Ubuntu)
- BIOS* – 61.7 Watts
- GRUB menu – 55.3 Watts
- Idle** – 29.4 Watts (Windows) and 22.8 Watts (Ubuntu)
- 4K Video playback*** – 45.1 Watts (Windows) and 65.8 Watts (Ubuntu)
- Gaming benchmark*** – Up to 280-290 Watts (Windows) and up to 250-260 Watts (Ubuntu)
- CPU stressed – 145.5 Watts then drops to 98.0 Watts (Ubuntu)
* BIOS (see below).
** Idle is when the fans are not running.
*** The power figures fluctuate so the value is the average of the median high and median low power readings. The in-game benchmark from Shadow Of The Tomb Raider was used and the maximum power draw occurred during the market scene near the end of the benchmark. The 4K video power draw in Ubuntu was higher than Windows due to software decoding of the VP9 codec in Ubuntu whereas Windows used hardware acceleration.
Thermals and Noise
Perhaps the most interesting aspect of the NUC9i9QNX is the thermal performance and consequential fan noise.
Whilst the Compute Element includes a small fan and the graphics card includes two fans, the top of the NUC also has a pair of 80mm fans:
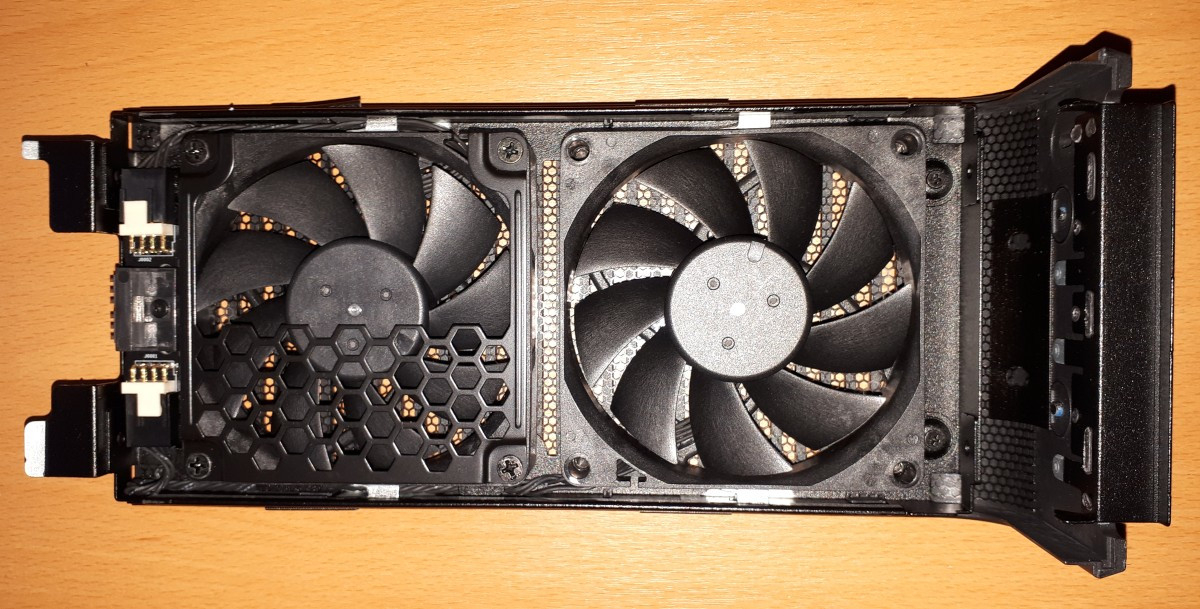
all of which will contribute to noise under load.
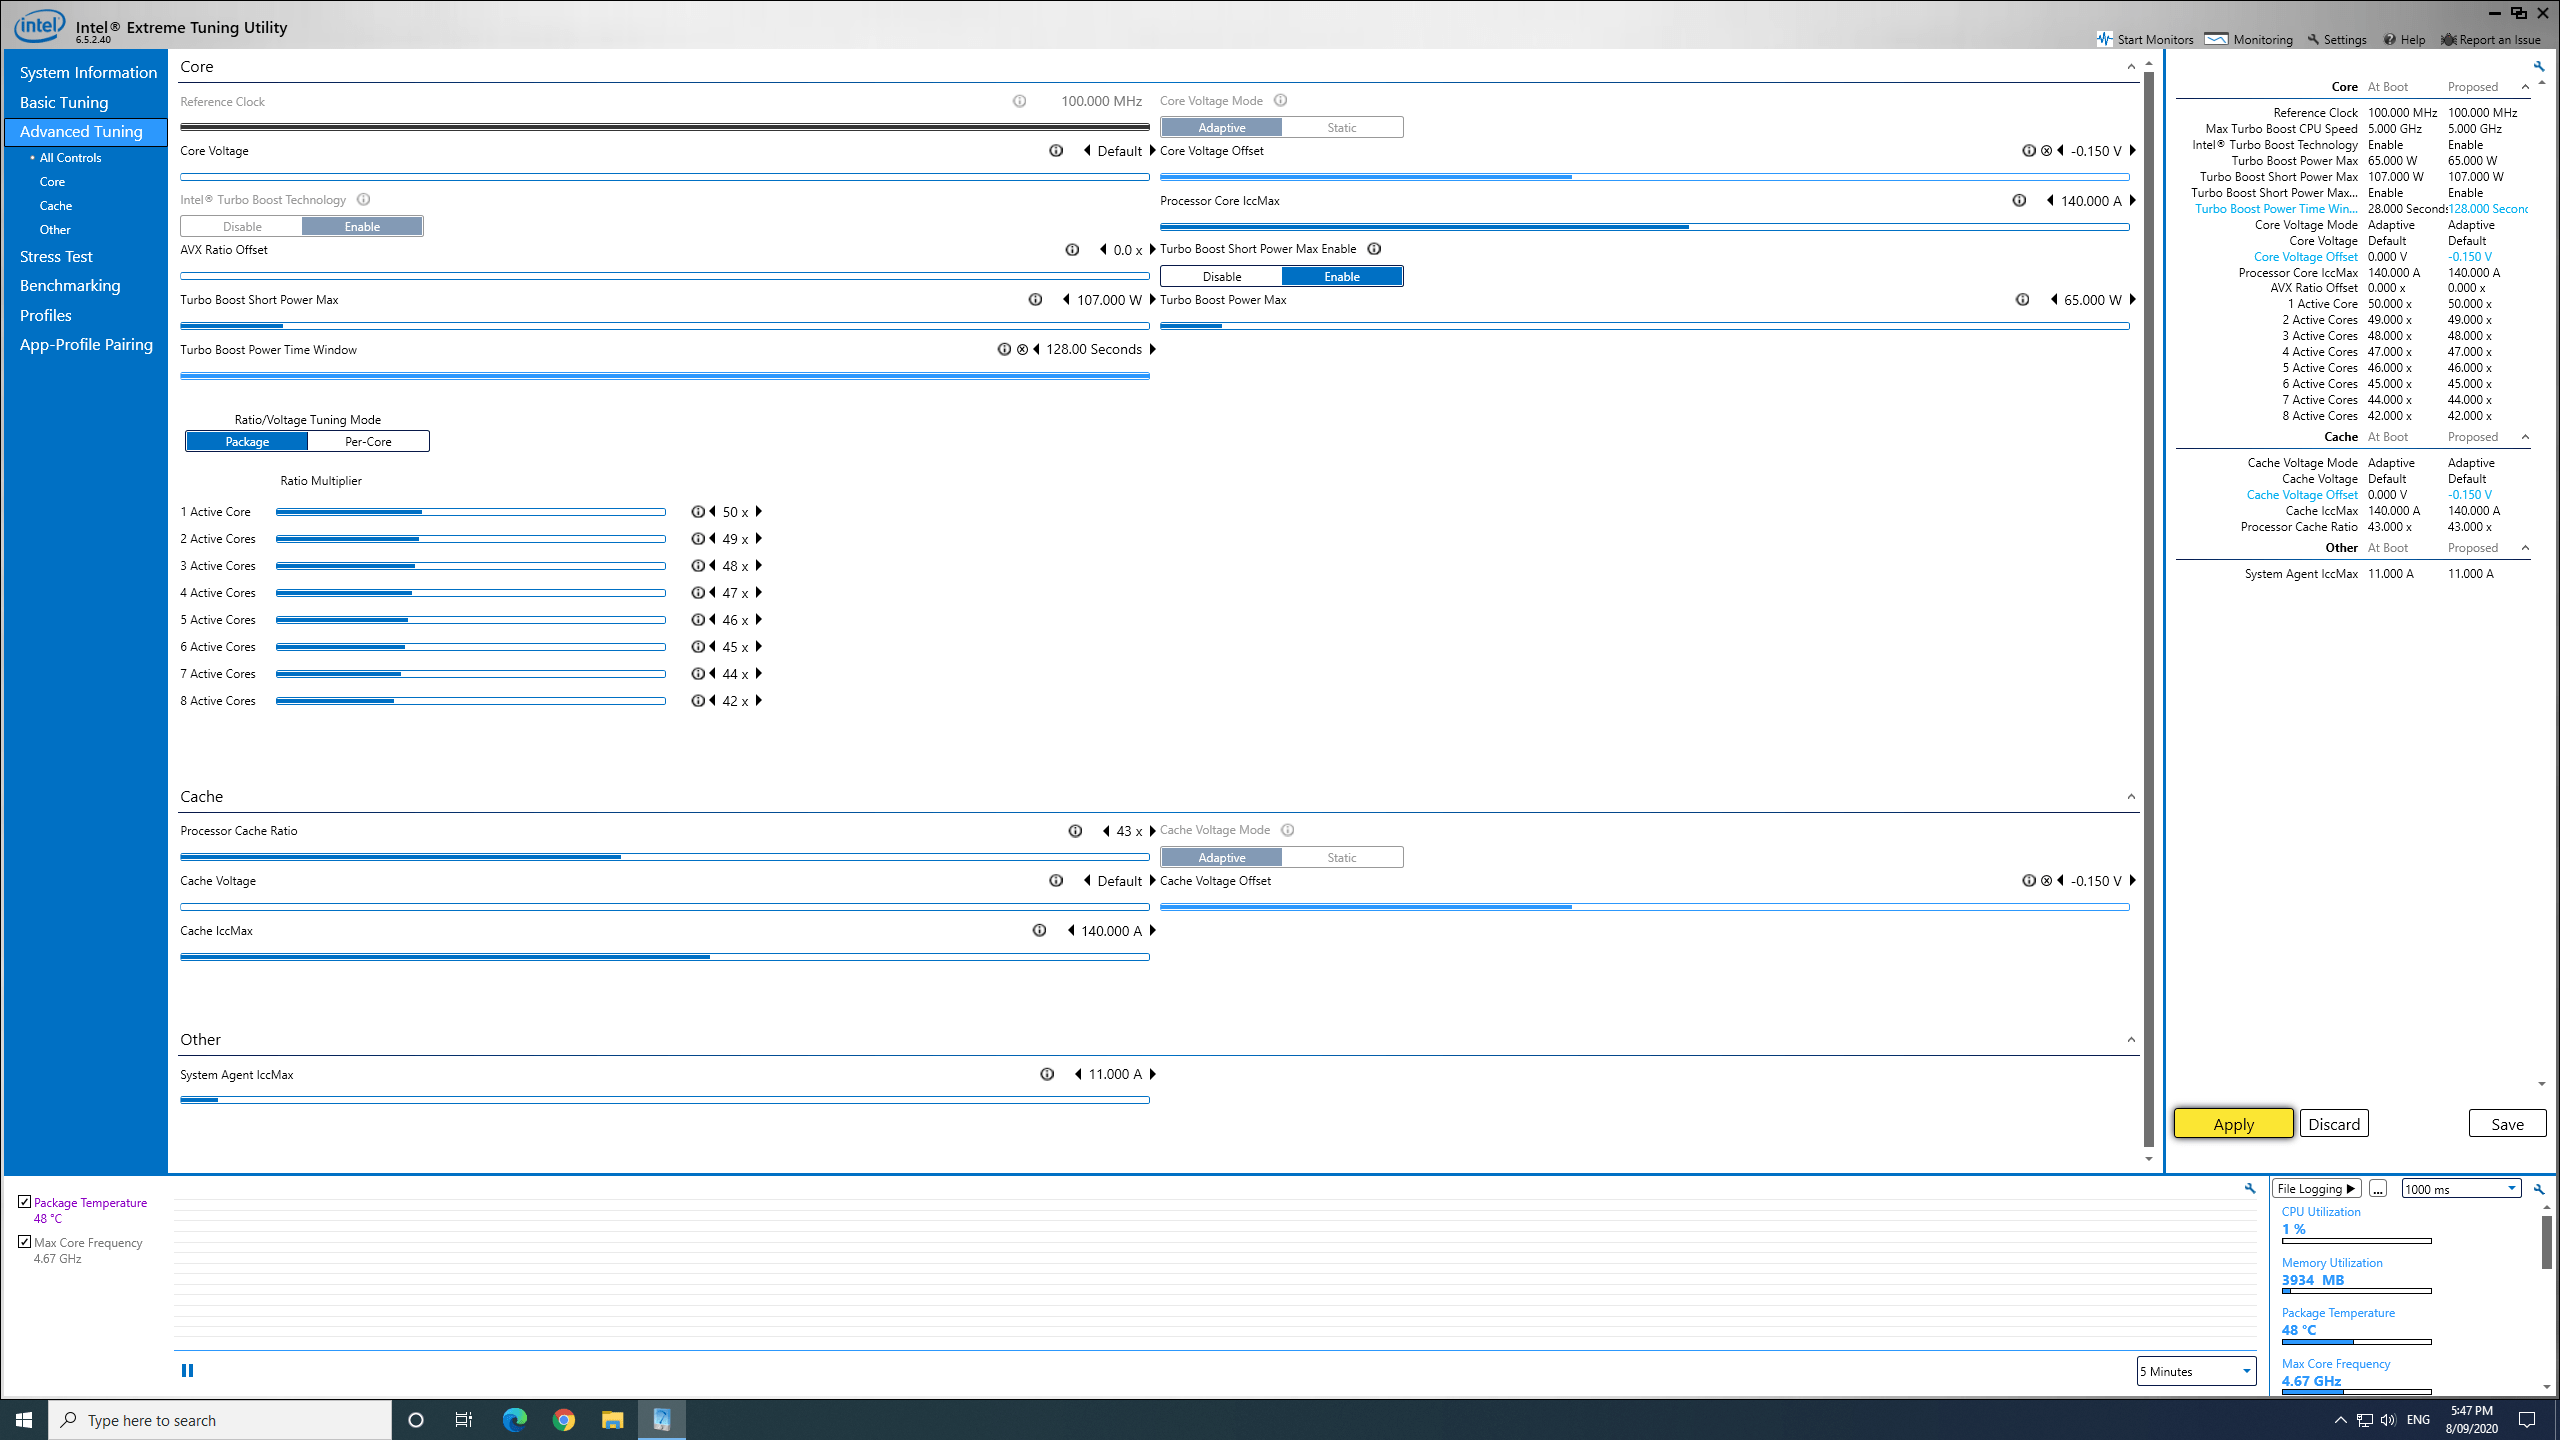
I decided to measure package temperature and maximum core frequency using Intel’s Extreme Tuning Utility on Windows as it both gave me a visual graph of the metrics and allowed me to log them to a file. For Ubuntu, I created a logging script that captured similar information from key files under “/proc” and “/sys”. The room temperature was 20.3°C on the day I tested on Windows and 18.4°C the following day when I tested on Ubuntu.
I ran three comparable processes in each OS whilst collecting the logs and then afterward I aligned each log file for each OS and plotted the results.
Playing a 4K 60 FPS YouTube video in Chrome:
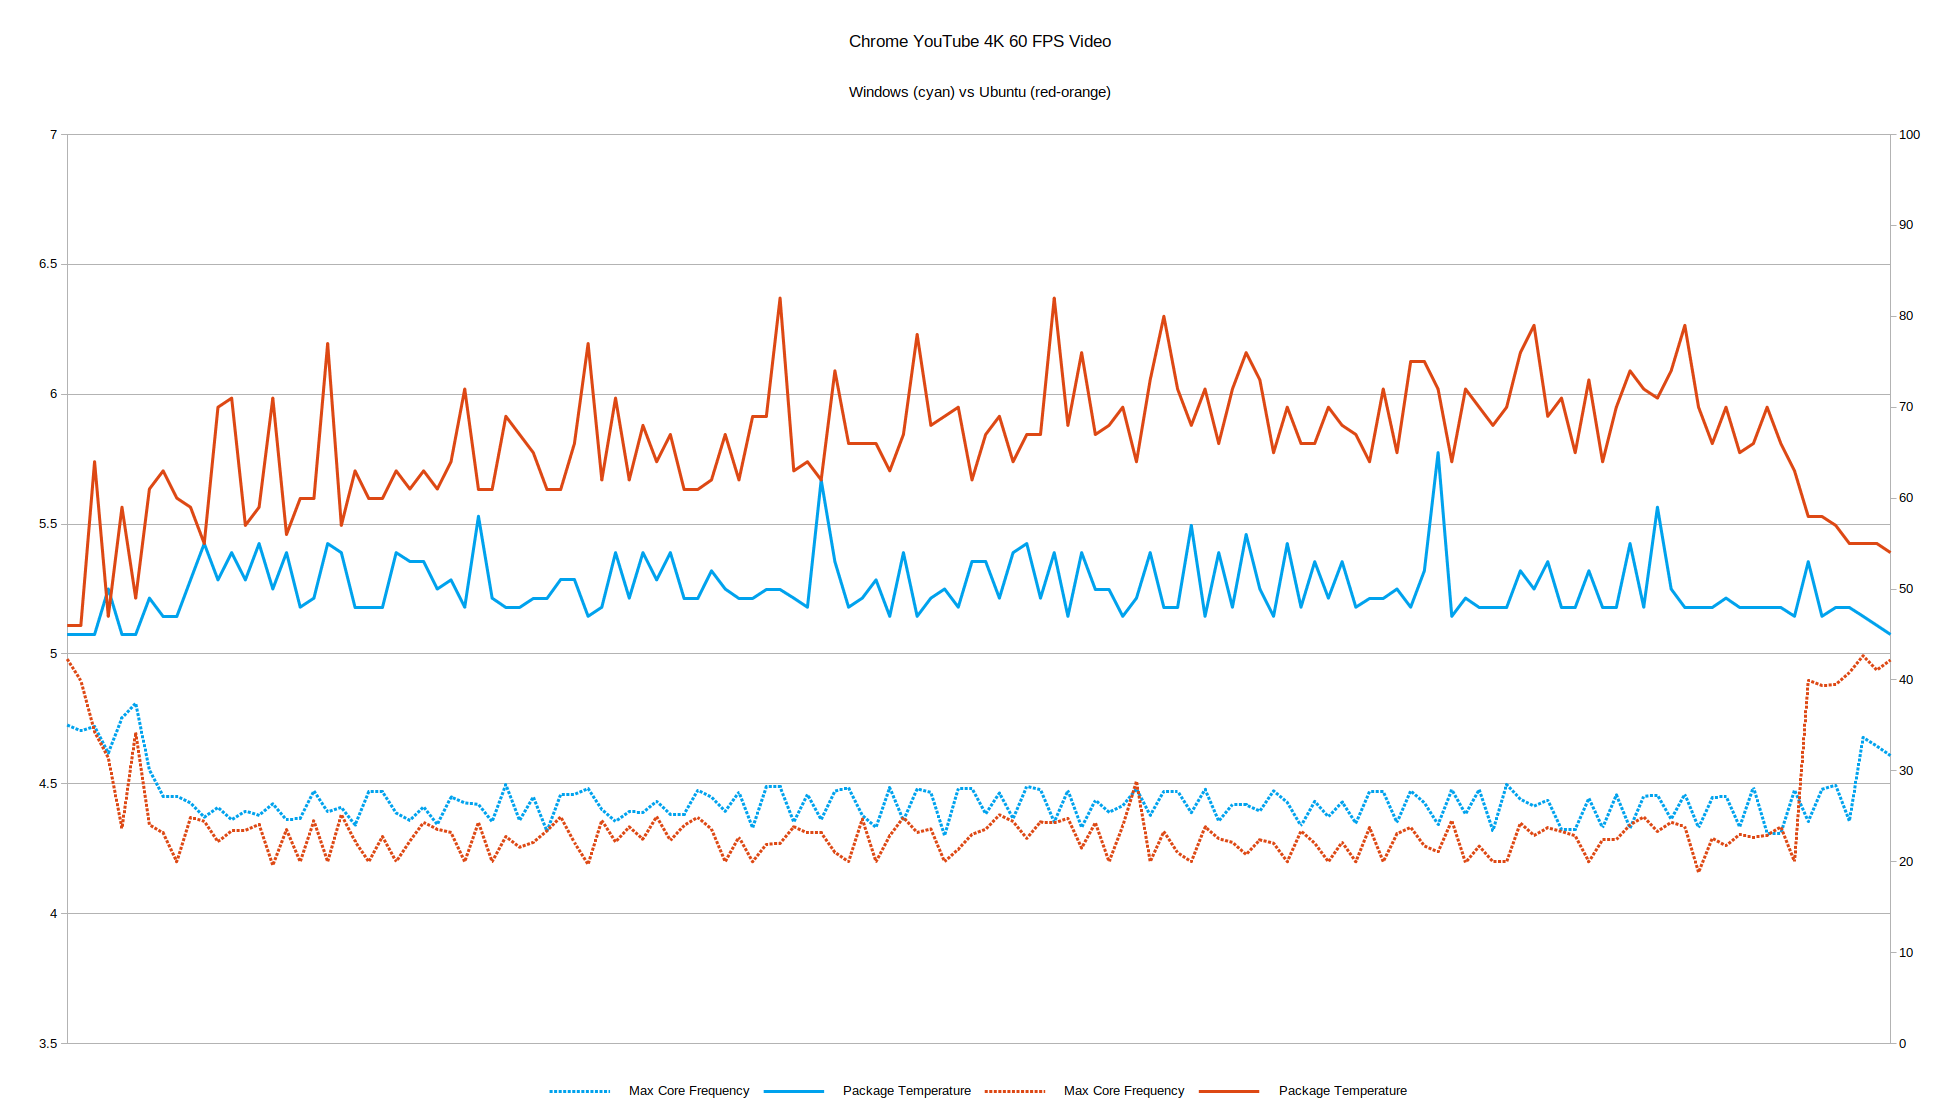
This clearly shows the difference of hardware acceleration being used by Windows vs software decoding by Ubuntu. Because of the higher processor load, Ubuntu runs hotter and the processors are clocked lower as a consequence. The average package temperature in Ubuntu is 66.1°C but just 50.0°C in Windows whereas the average maximum core frequency is lower in Ubuntu at 4.3408 compared to 4.4451 in Windows.
Geekbench 5 CPU benchmark:
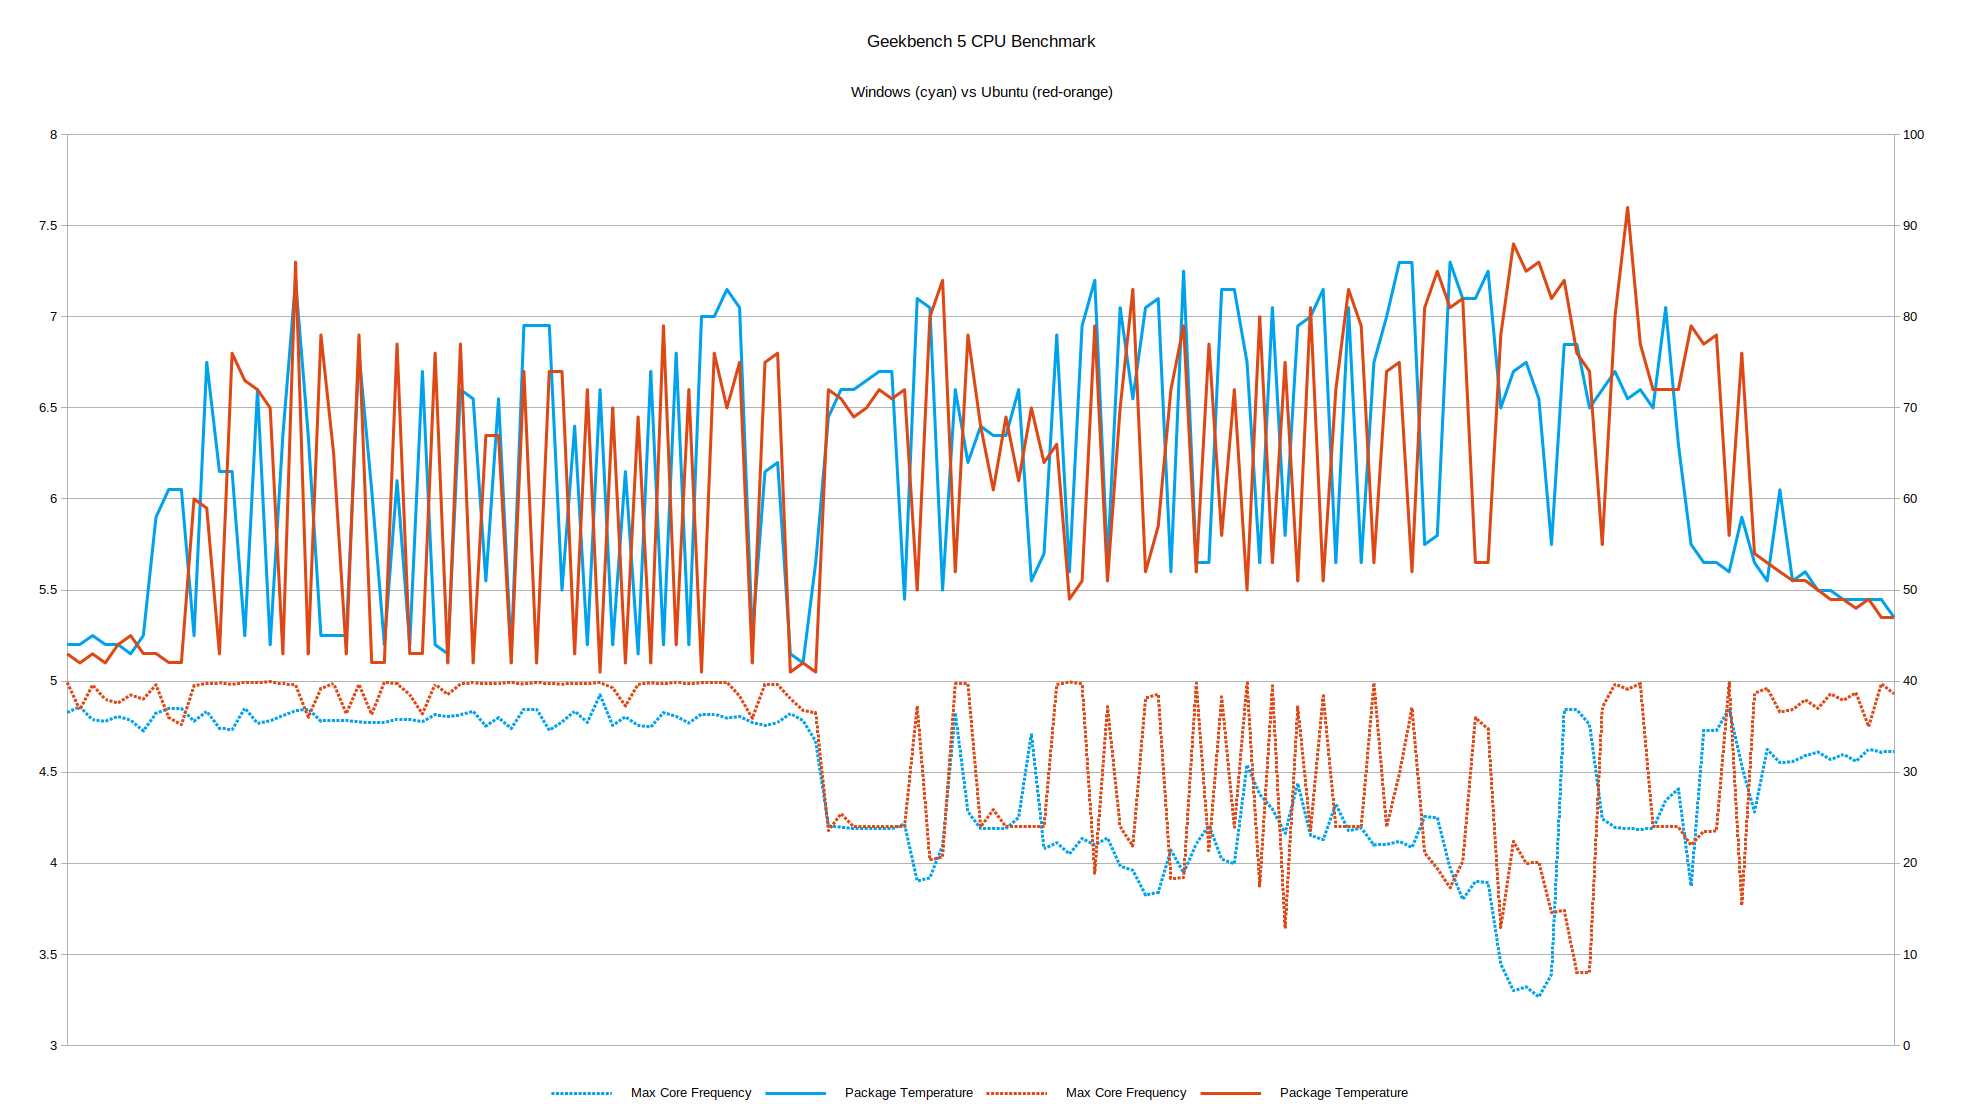
The split between the single-core and multi-core benchmarks is also evident. Ubuntu maintains a higher average maximum core frequency in both benchmarks whilst maintaining a lower average package temperature. For the single-core benchmark, the average package temperature in Ubuntu is 56.6°C and slightly higher in Windows at 58.3°C with the average maximum core frequency in Ubuntu at 4.9451 but lower in Windows at 4.7951. For the multi-core benchmark whilst the average package temperature is the same at 67.1°C in both Ubuntu and Windows the average maximum core frequency in Ubuntu is higher at 4.4229 compared to 4.2152 in Windows.
Running the in-game benchmark from Shadow Of The Tomb Raider:
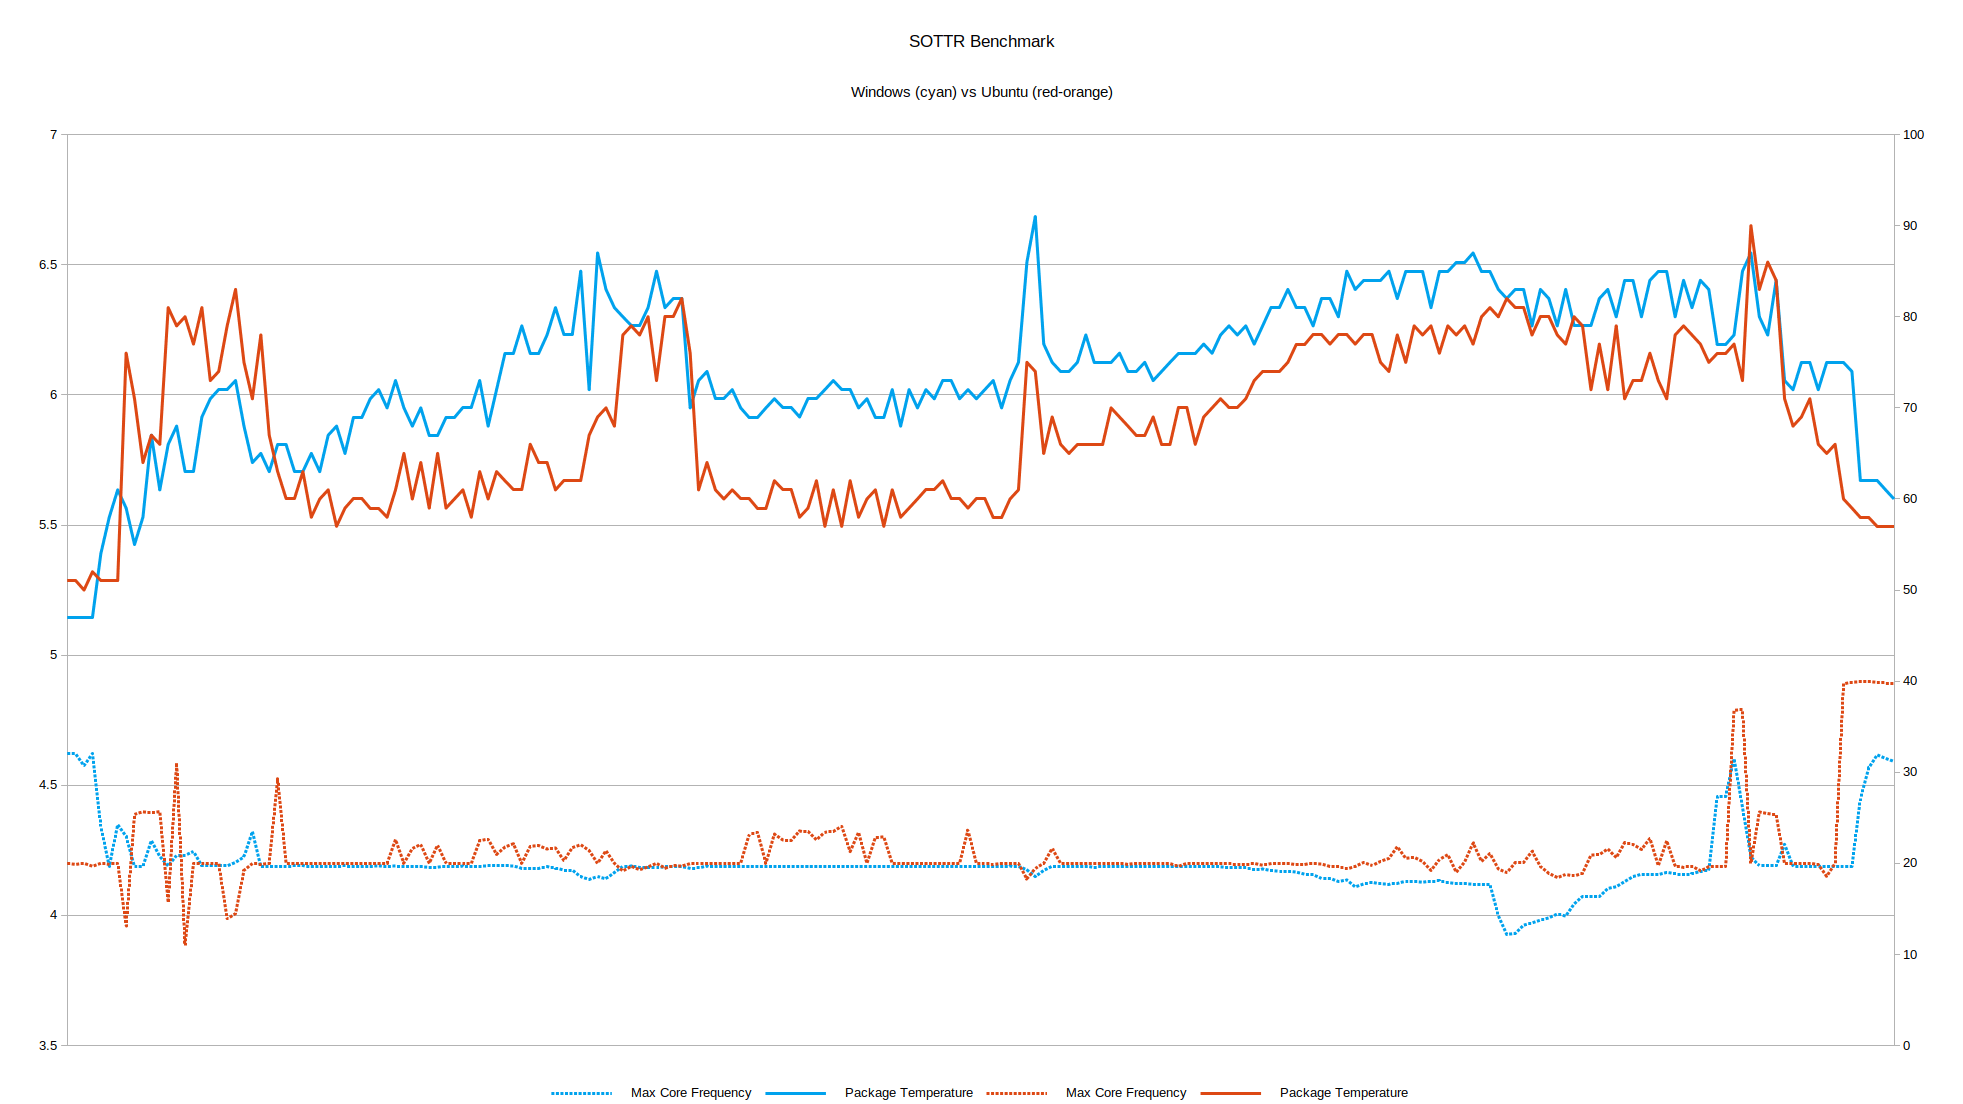
The average FPS in Windows is 10 frames higher than in Ubuntu and as a result, the average package temperature in Windows is 74.4°C compared with 67.7°C in Ubuntu which also results in a lower average maximum core frequency in Windows of 4.1933 compared with 4.2677 in Ubuntu. If you take into consideration the power usage (see above) it can be seen that Windows is working much harder to achieve those extra frames.
This is also when the fans become really noticeable. When the device is idle, the fans are off leaving just the ambient room noise measuring around 33 dBA. When the fans are just “ticking” over they are barely audible at around 36-37 dBA. However during the benchmark as the load and therefore CPU temperature rises the fans ramp up and in the market scene of the benchmark where the average package temperature starts to exceed 80°C the combined fan noise reaches 55-56 dBA:
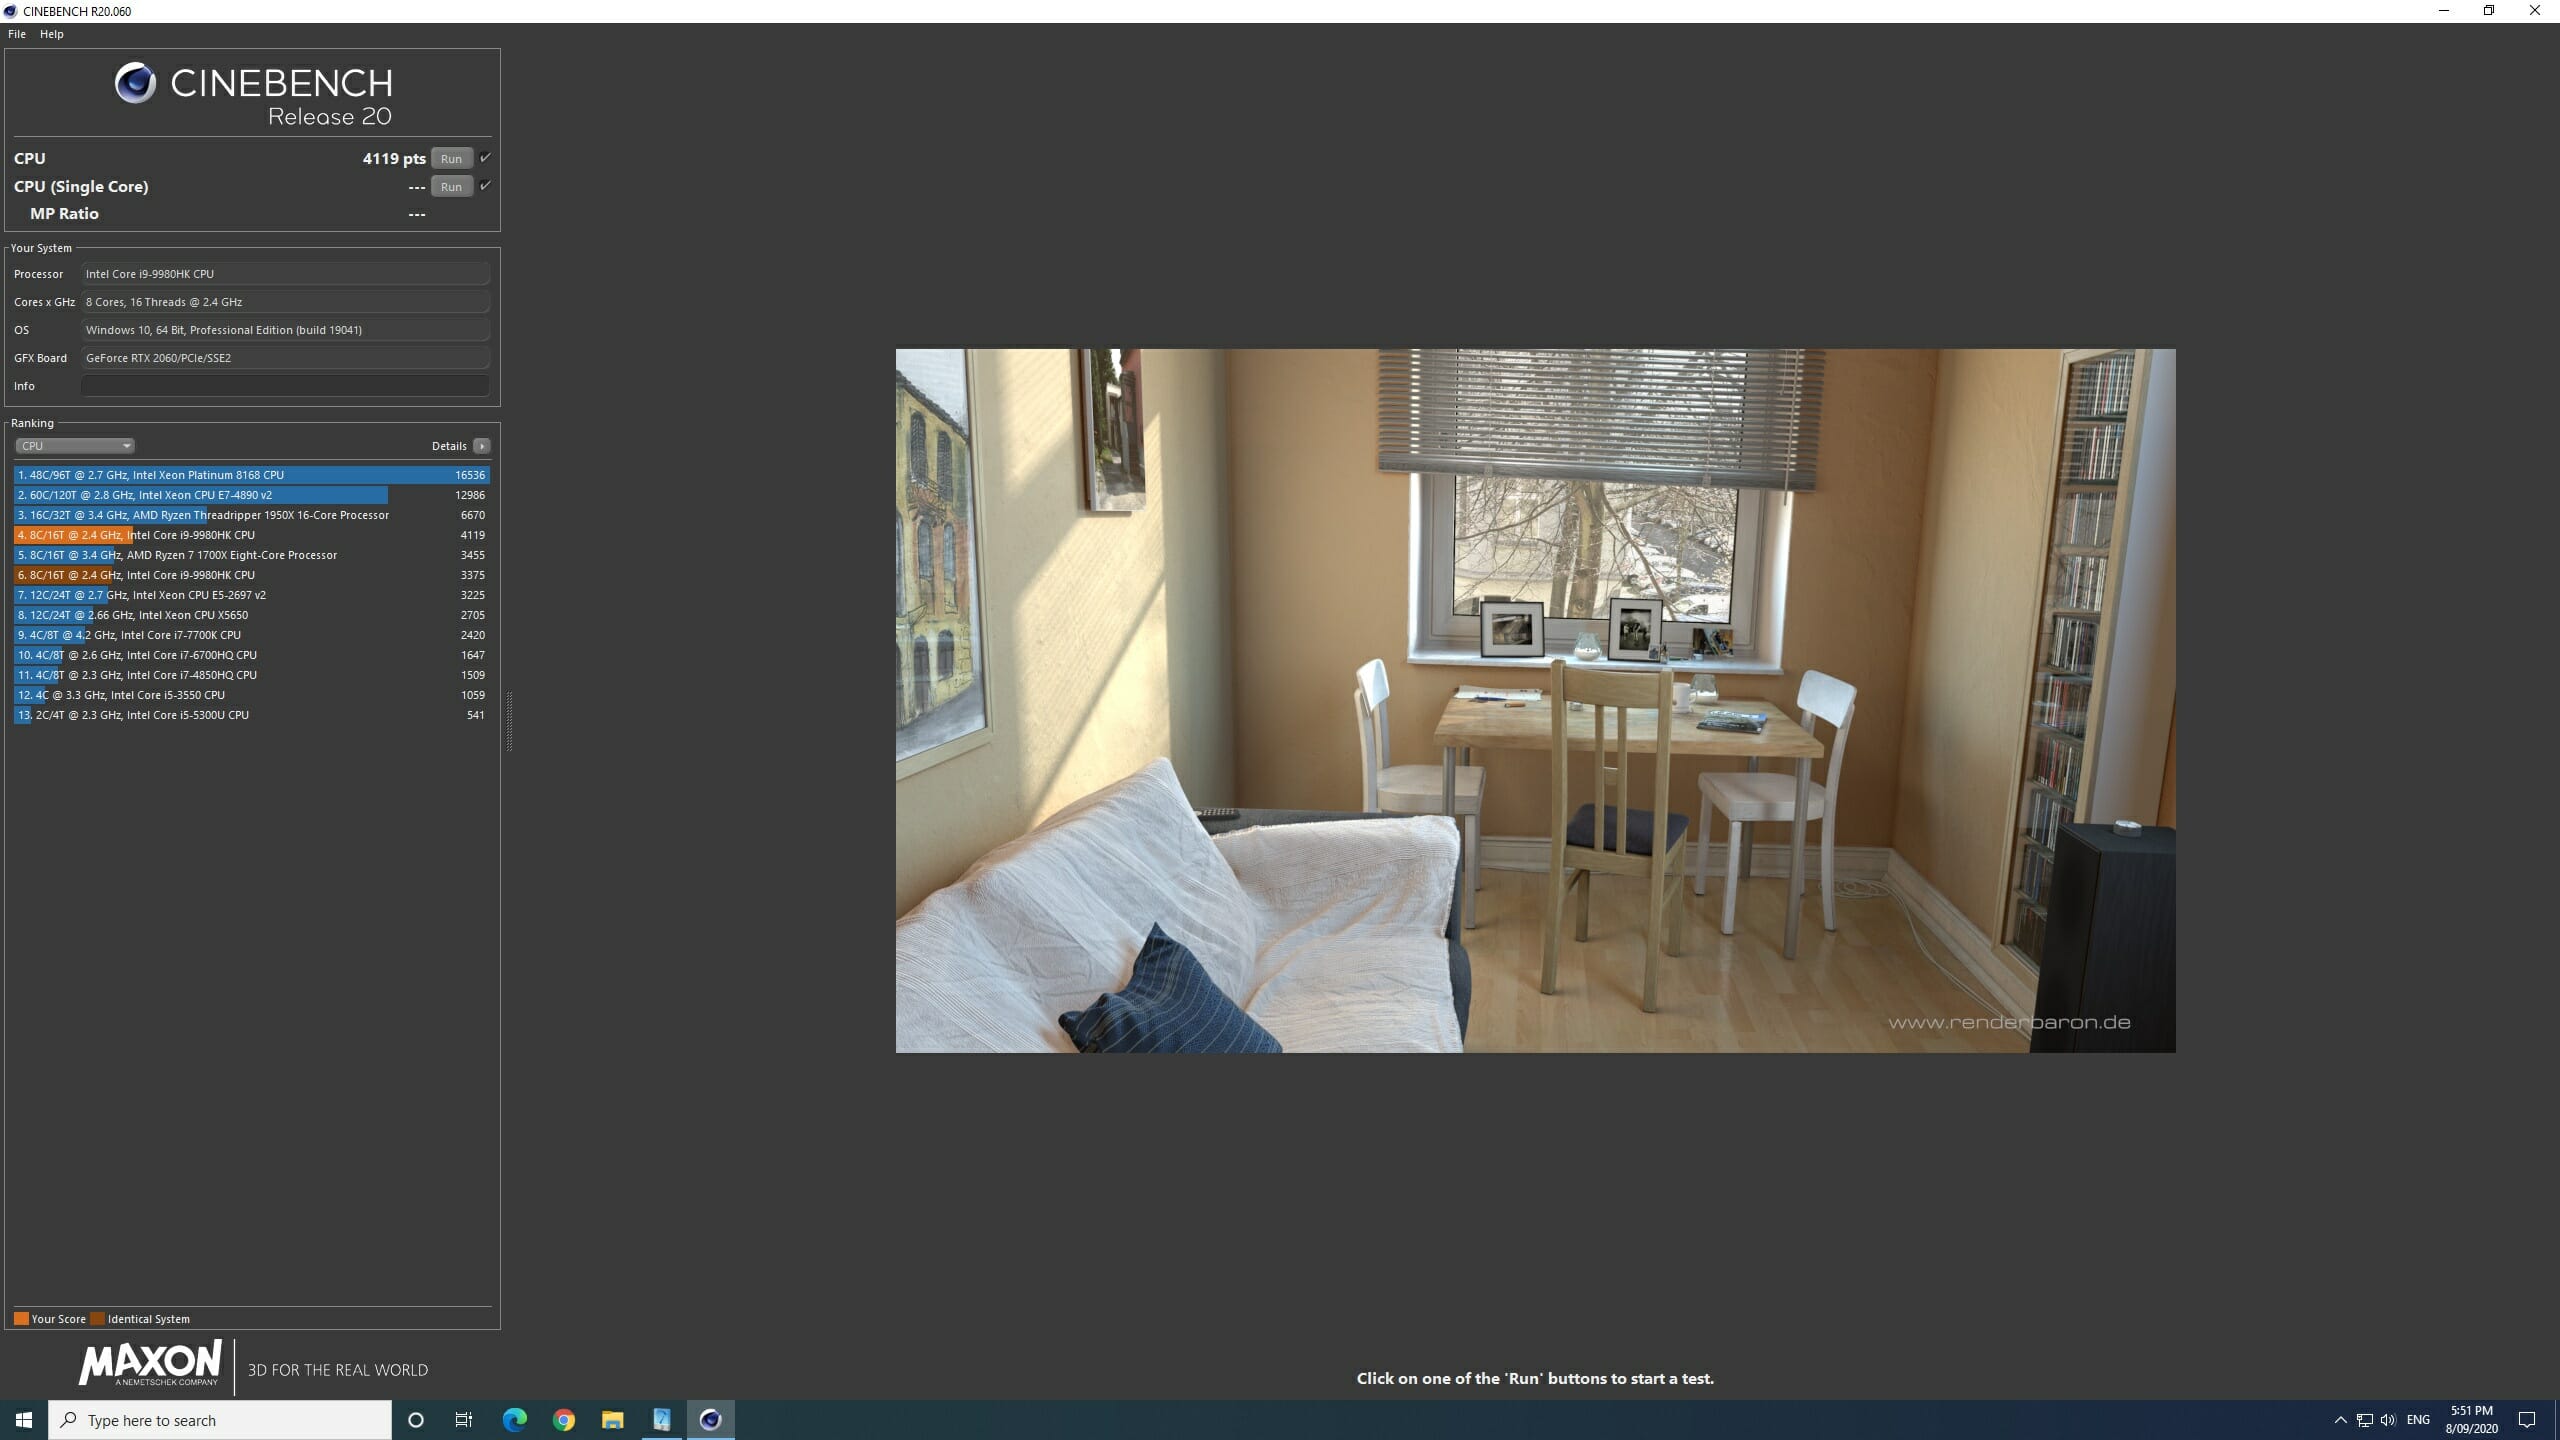
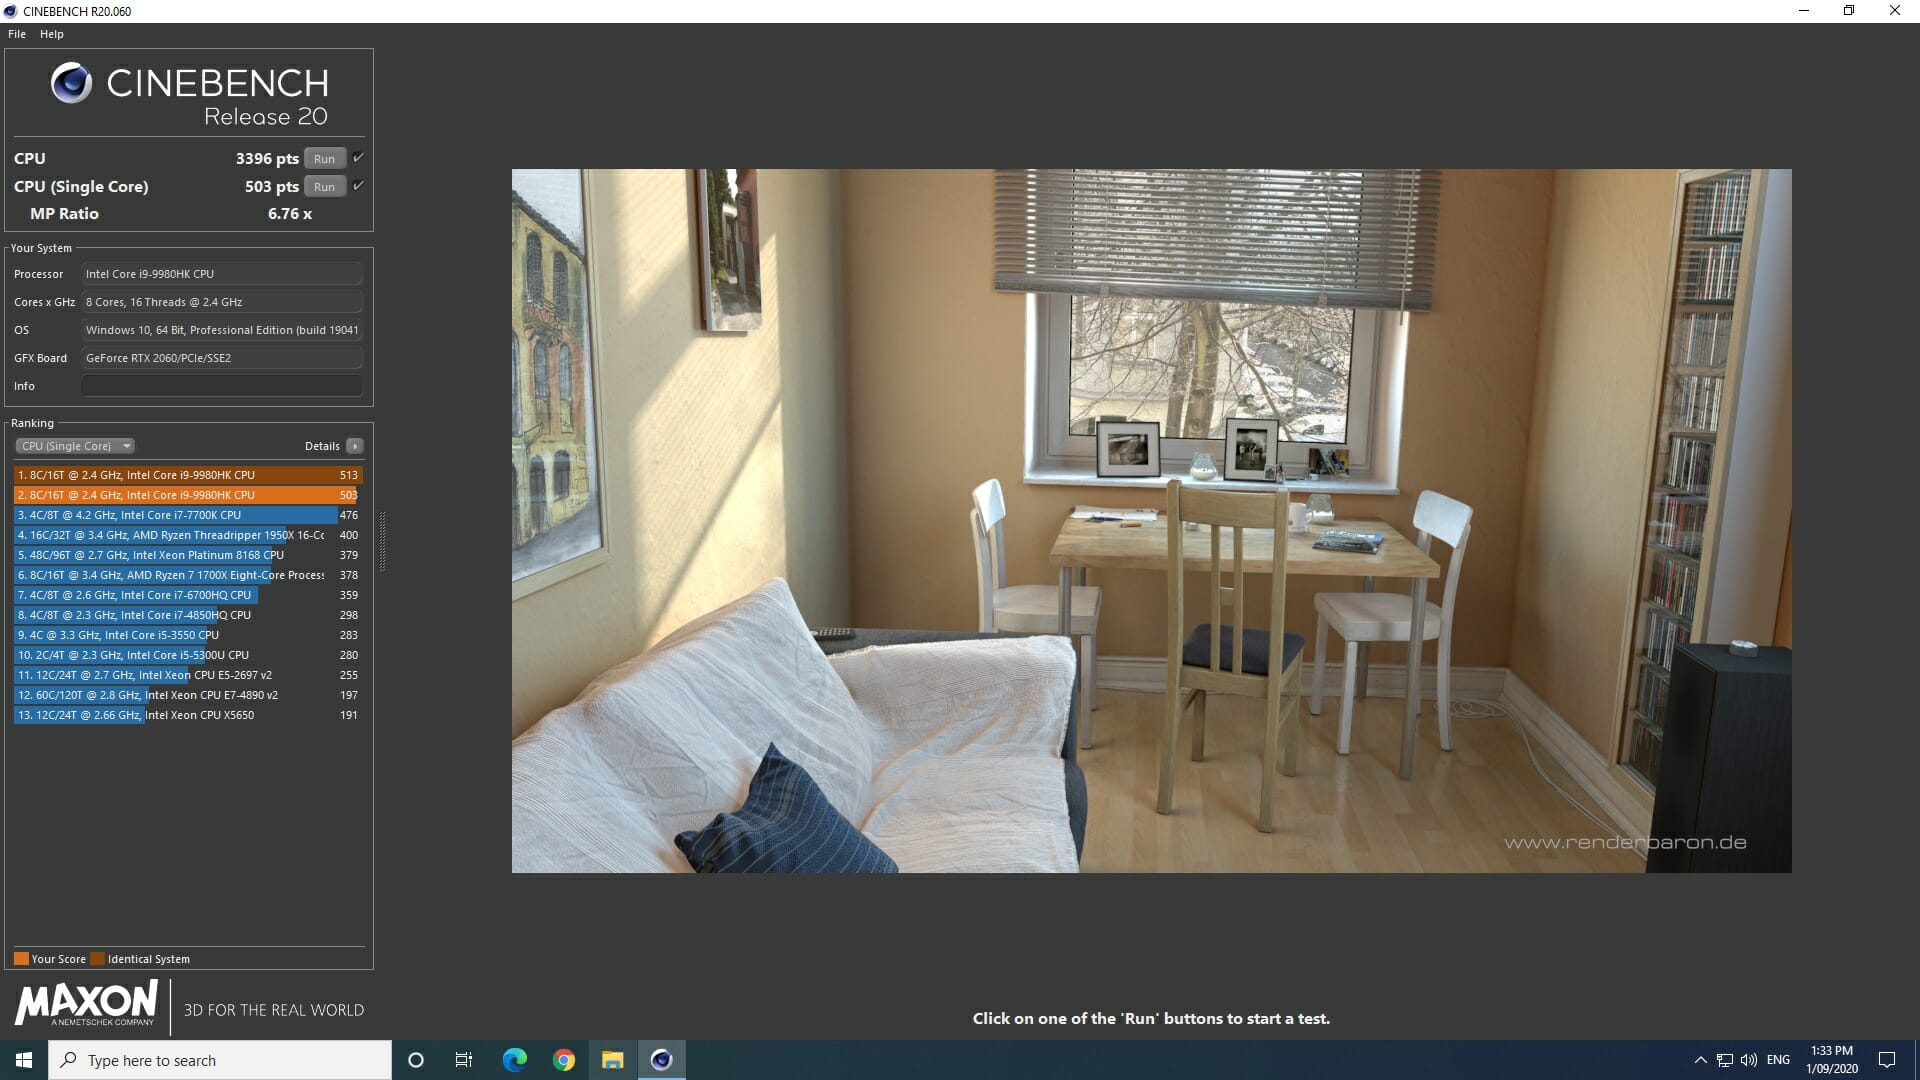
Additionally, I ran two CPU intensive tests to see the effectiveness of thermal cooling. The first was Cinebench R20 in Windows:
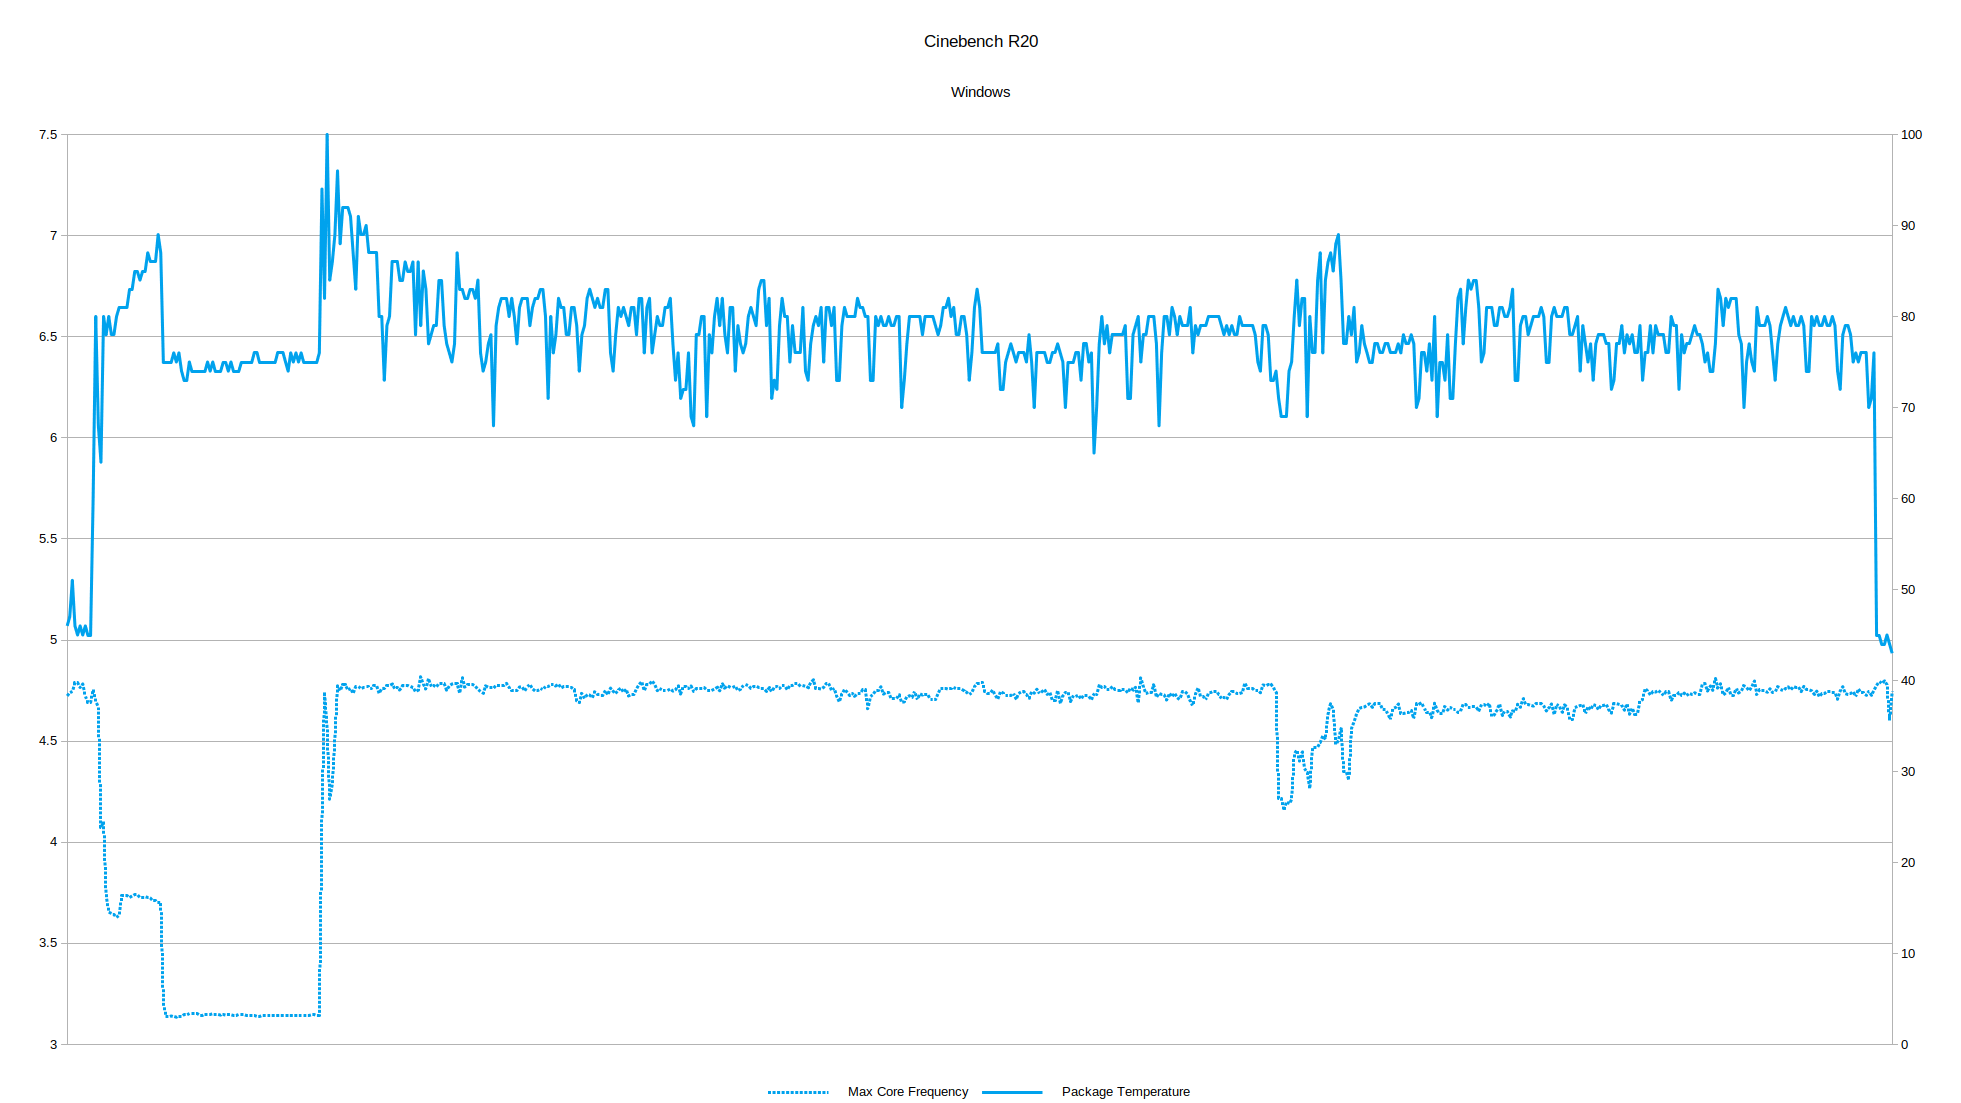
where I ran both the multi-core and single-core tests in one run. Of interest is the start of the single-core test where the maximum core frequency jumps from 3.1459 to 4.7429 and the package temperature suddenly peaks at 100°C which immediately forces the maximum core frequency down to 4.2132 before it stabilizes at around 4.7455 with an average package temperature of 79.1°C in the central section of the overall run. Note that 100°C is TJunction which is the maximum temperature allowed at the processor die and arguably not something you should be reaching given stock settings.
The second test was a stress test in Ubuntu:
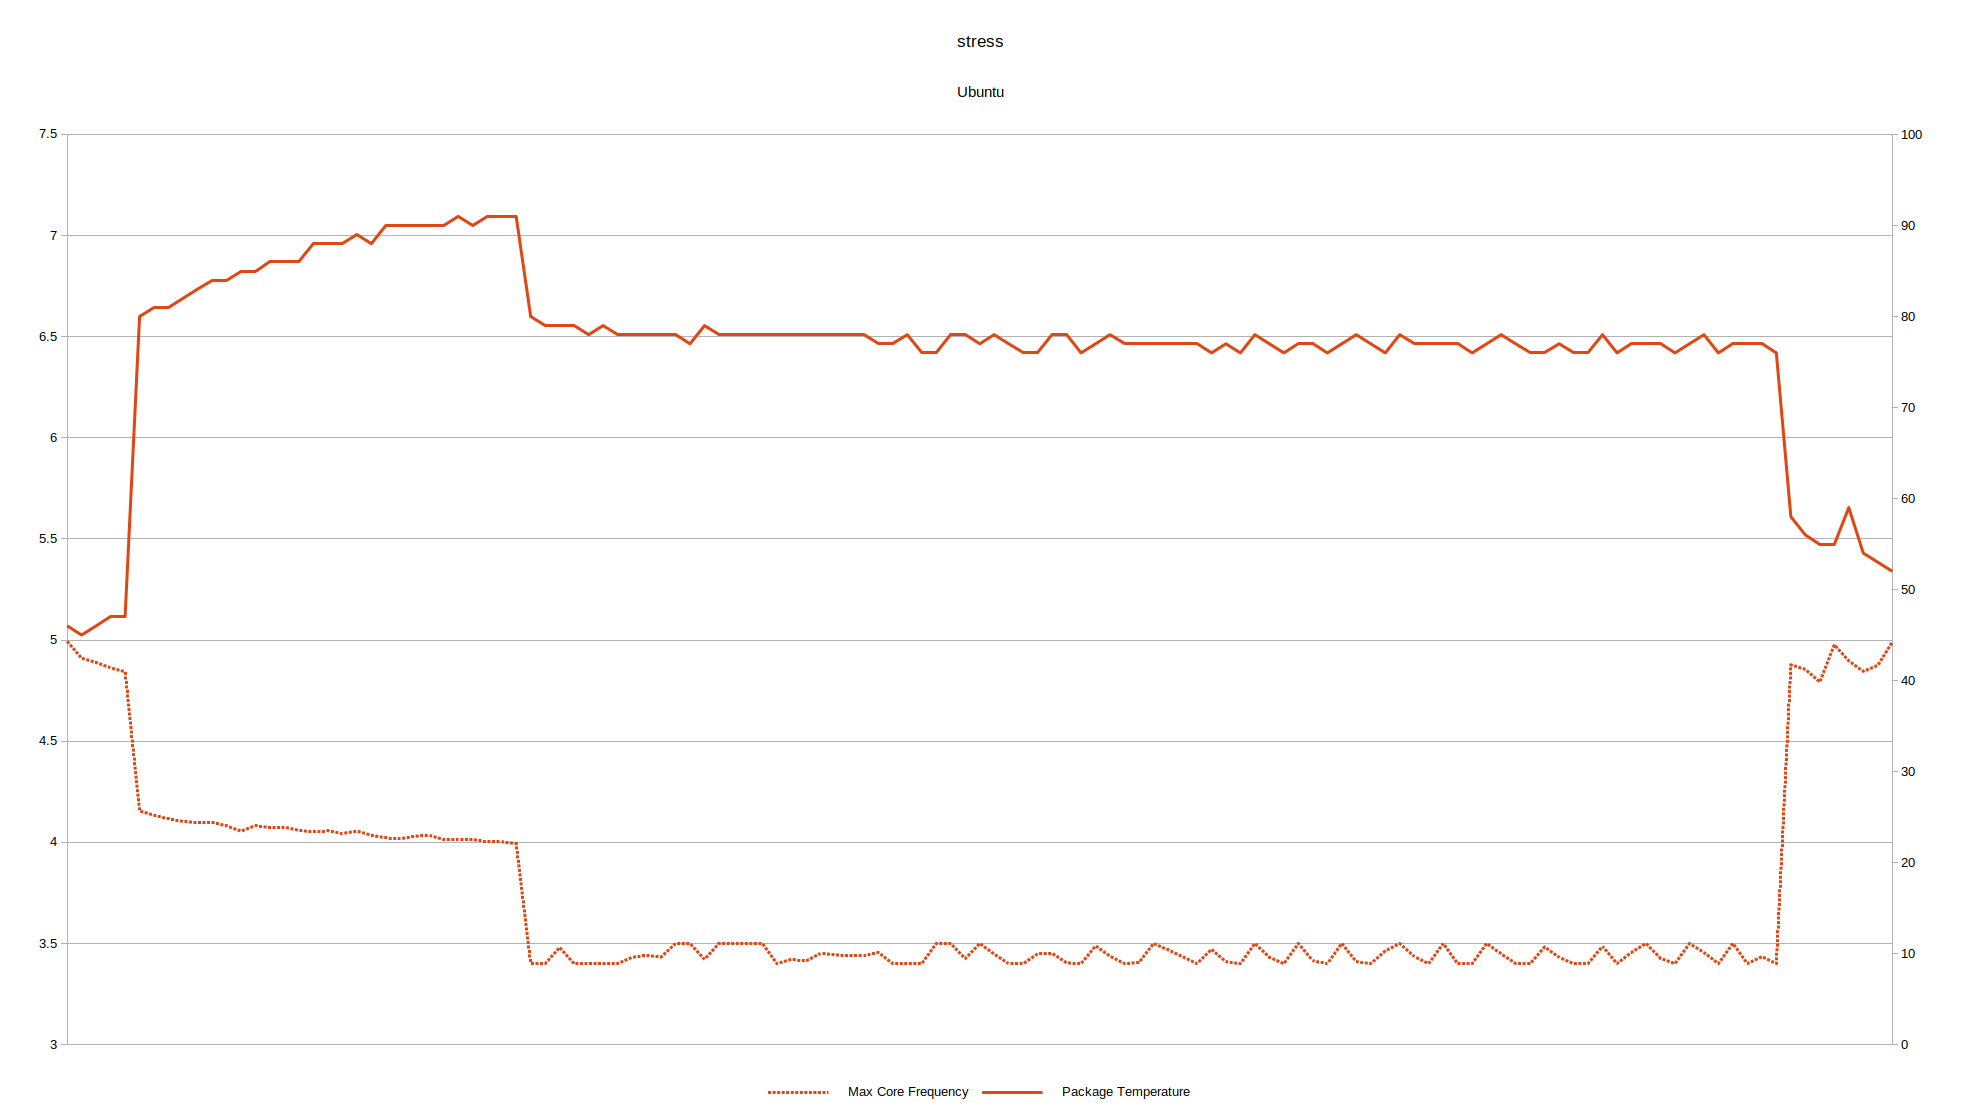 where you can see the temperature rising during the “Tau” or “Turbo Boost Power Time Window” that PL2 can be sustained (28 seconds). During this period the package temperature rose to 91°C which is just about at the maximum you would want to see.
Despite the high temperature, the fans are effective and the CPU cools down very quickly once no longer under load.
Overclocking
The NUC9i9QNX’s i9-9980HK is an unlocked processor meaning that it supports overclocking. However, I’ve already shown that with the stock configuration the temperatures already run relatively high and close to the thermal limits. Rather than increase the clock speeds and therefore generate even more heat, I decided to try undervolting the CPU to allow it to boost higher or longer within the same power restrictions.
First, I experimented dropping the “Core Voltage Offset” whilst running Cinebench R20 multi-core. I settled on -0.150 V as this was stable. I then increased the value for “Tau” to a maximum of 128 seconds. Using this simple “overclock”:
I was able to significantly improved the scores from 3375:

to 4119:
although this did come with a 15°C temperature increase:
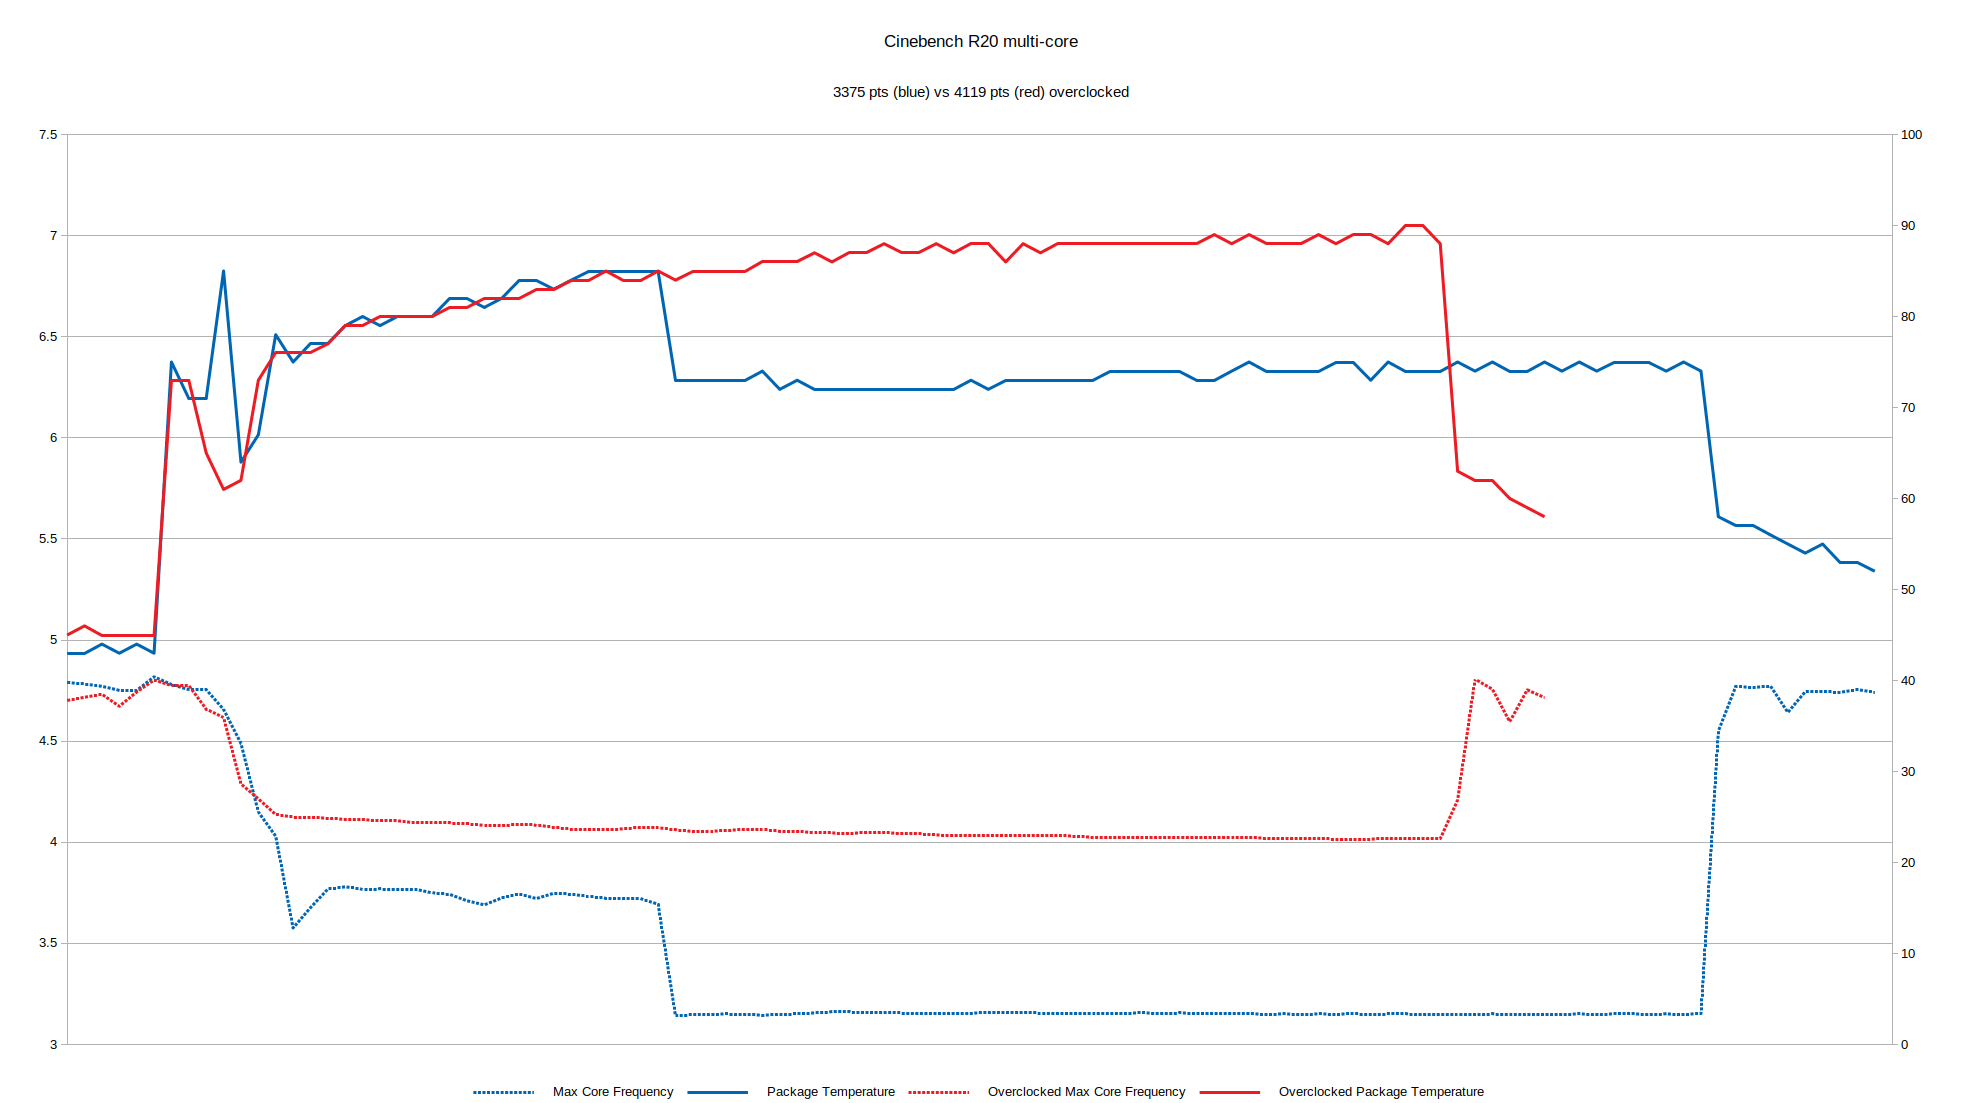
and also note how the elapsed time of the test is now shorter.
I also experimented increasing the value for PL1 from 65 W to 100 W whilst using Blender as my benchmark. With default settings the “BMW” benchmark took 4 minutes 27 seconds:
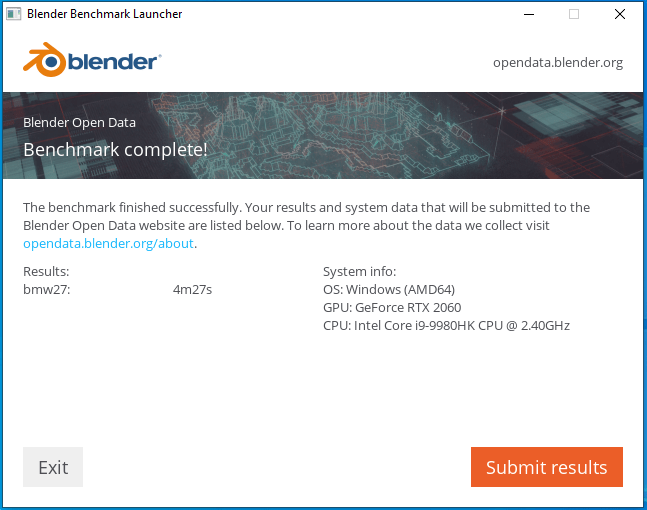
However with a -0.150 V undervolt, a Tau of 128 seconds and a PL1 of 100 W:
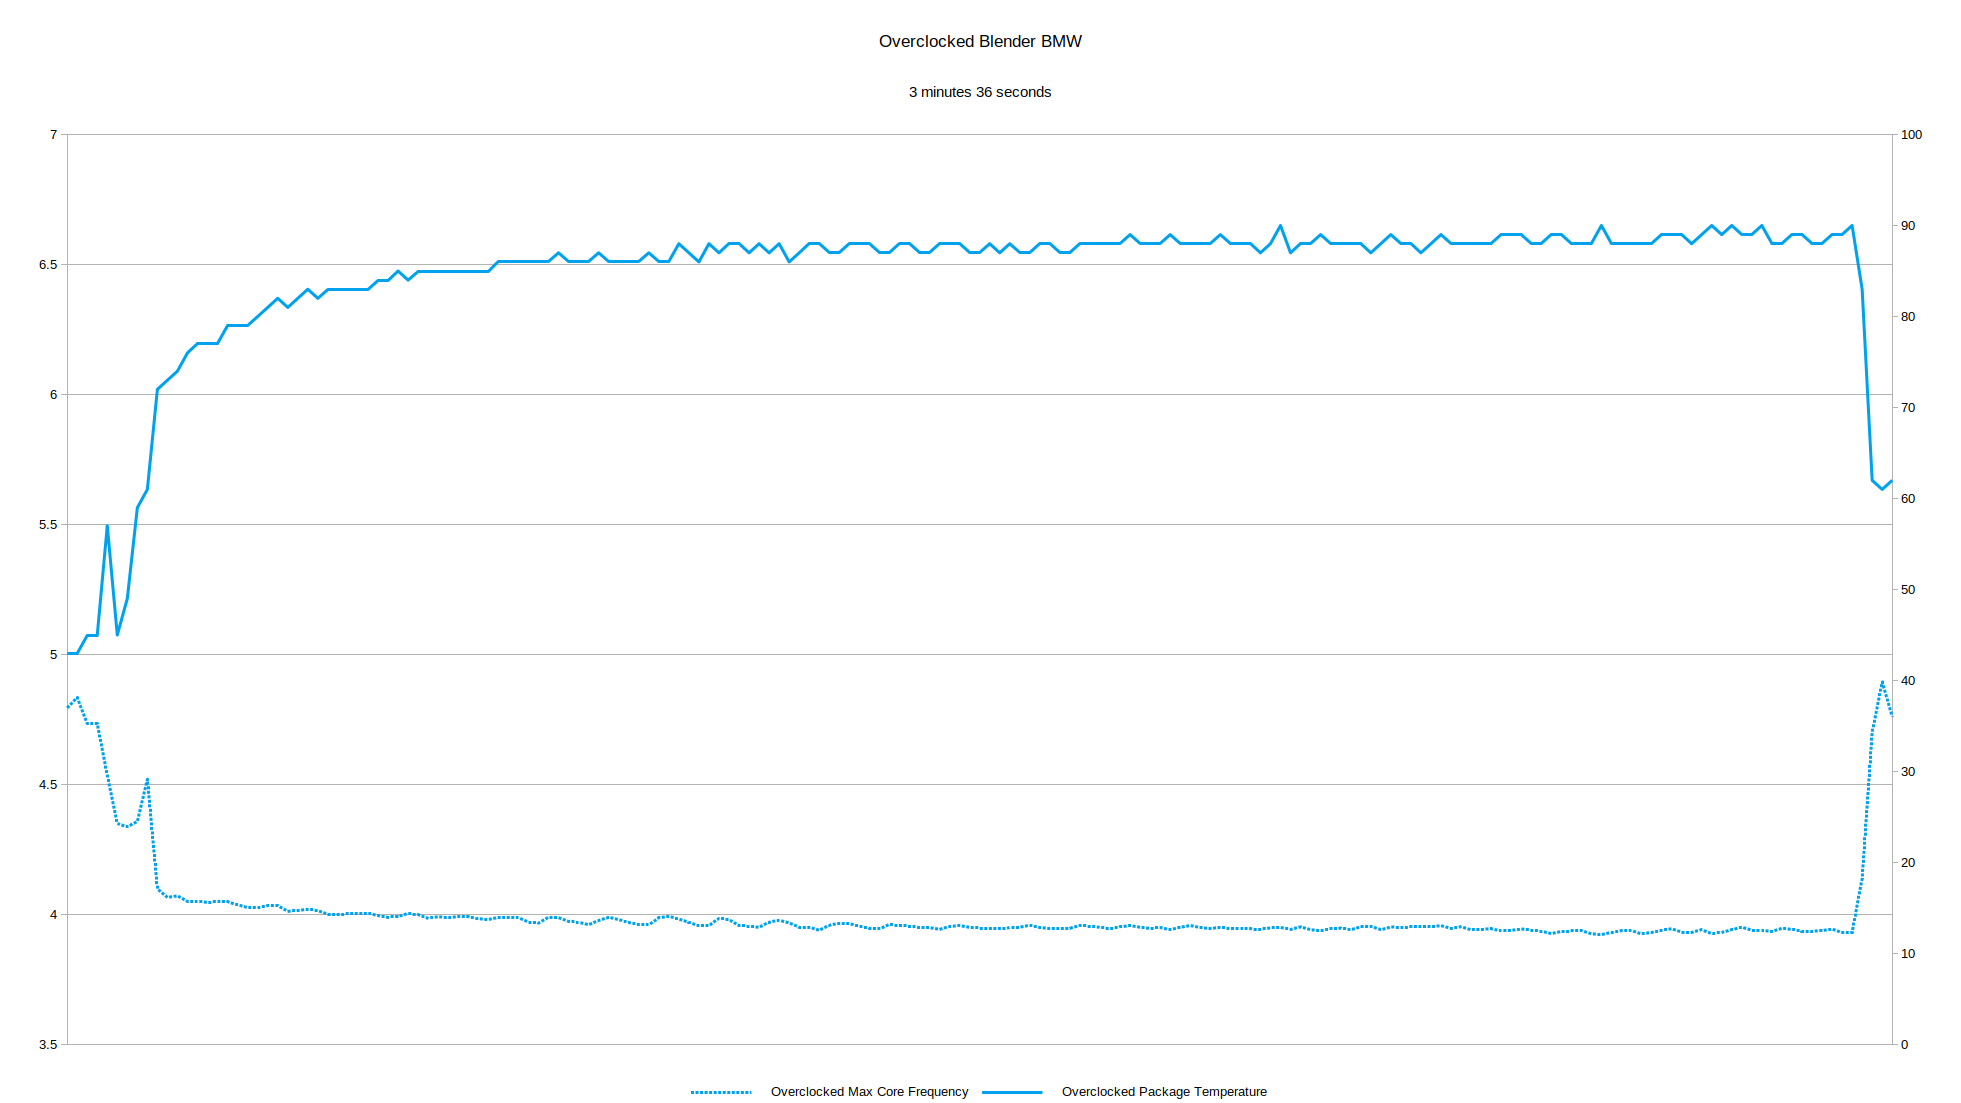
I achieved a significant improvement to 3 minutes 36 seconds:
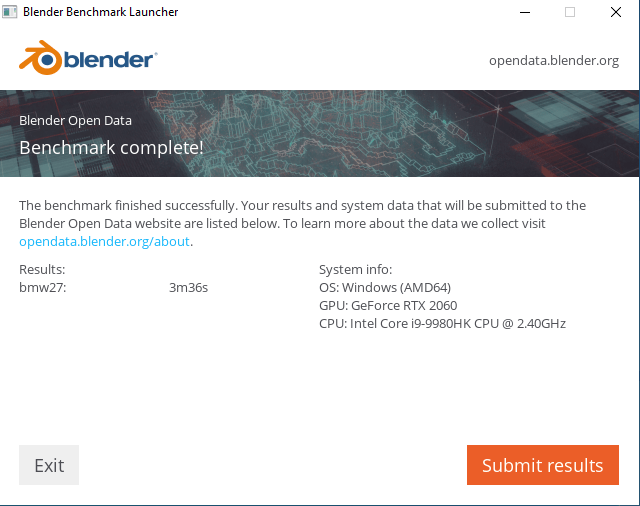
Again with the temperature averaging around 88°C for a substantial part of the test it is more indicative of the limits of overclocking rather than a practical setting for daily use:
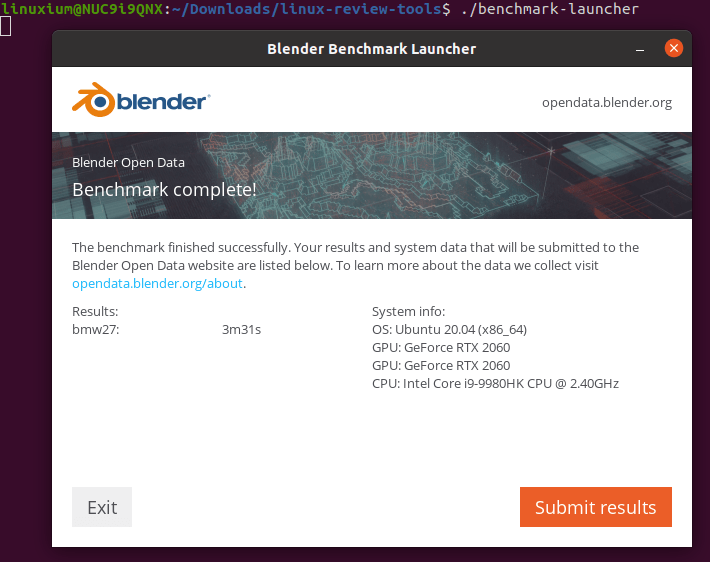
Just for reference, when running the same Blender benchmark in Ubuntu without any overclocking it only took 3 minutes 31 seconds:
Windows vs Ubuntu in NUC 9 Kit
Whilst a detailed comparison between the two operating systems is beyond the scope of this review, it is worth noting some of the key findings I observed. First looking at the performance tools common between the two systems:
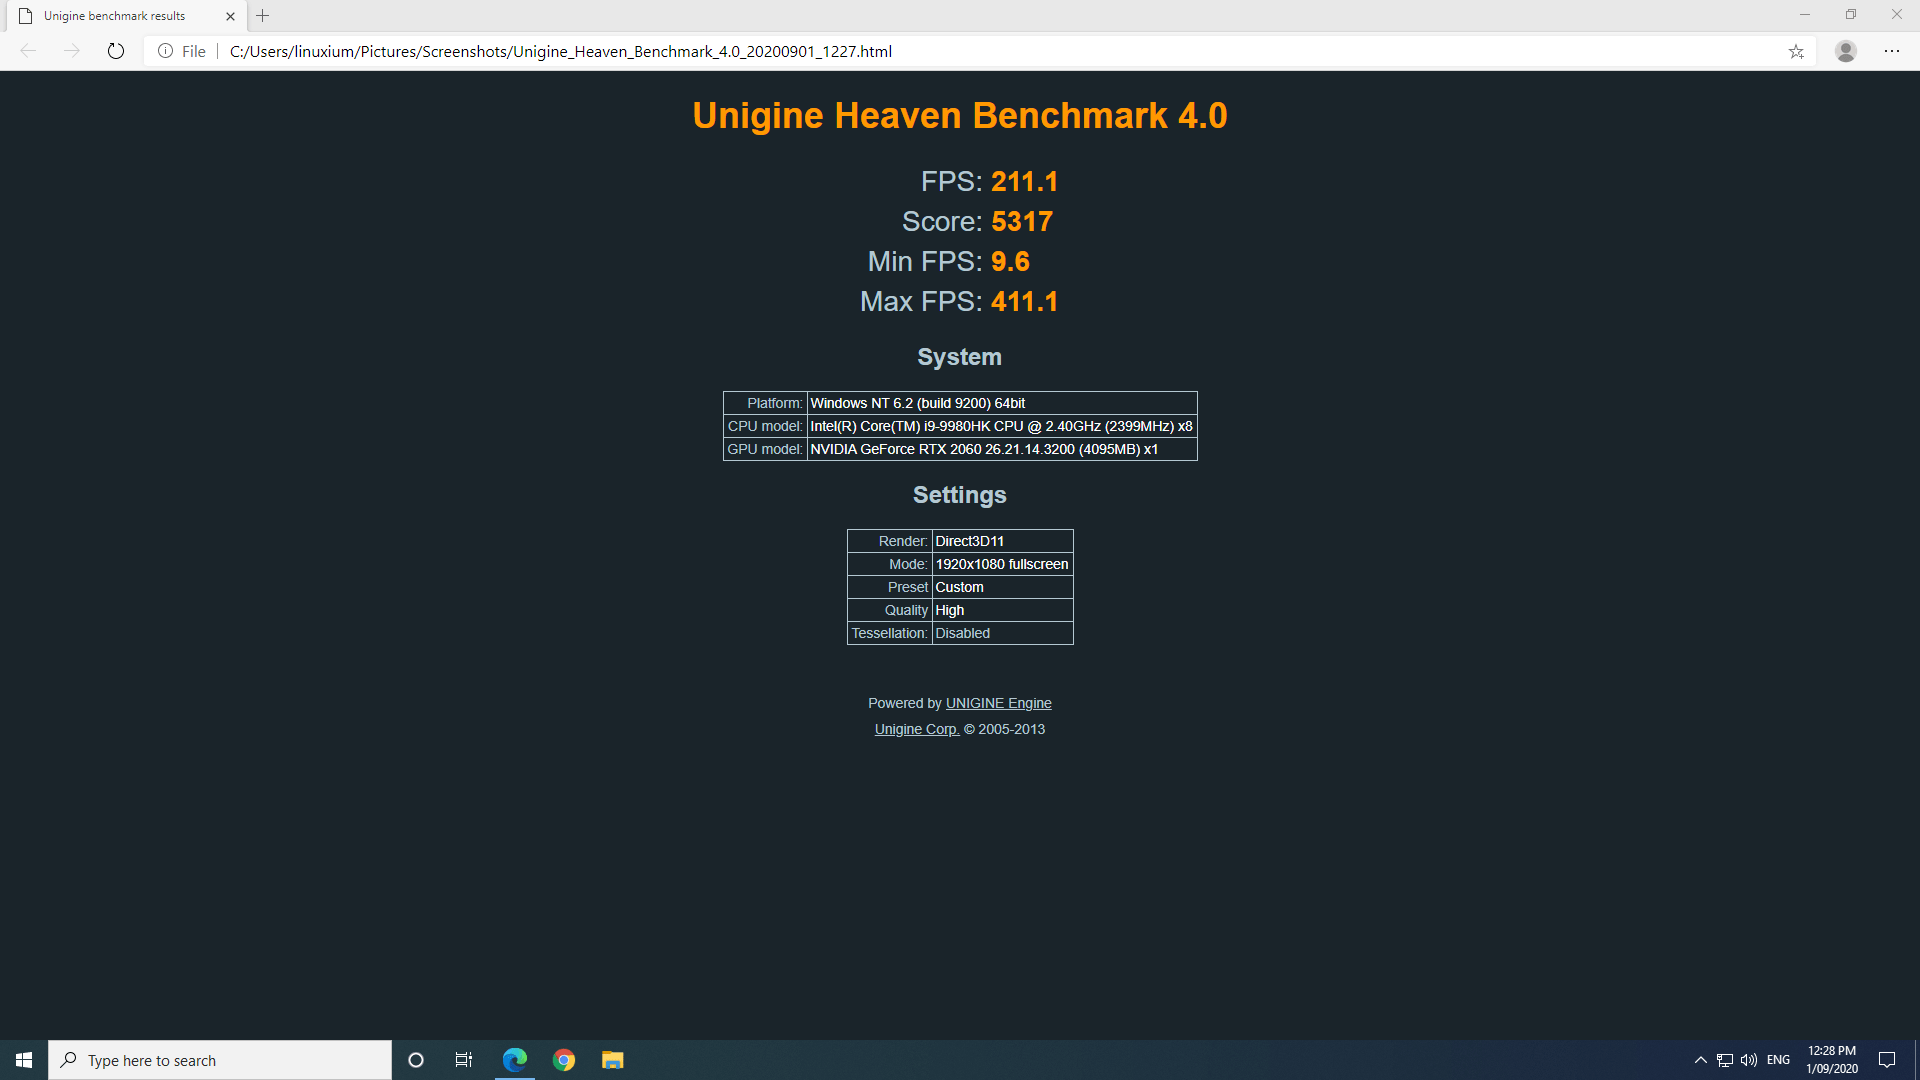
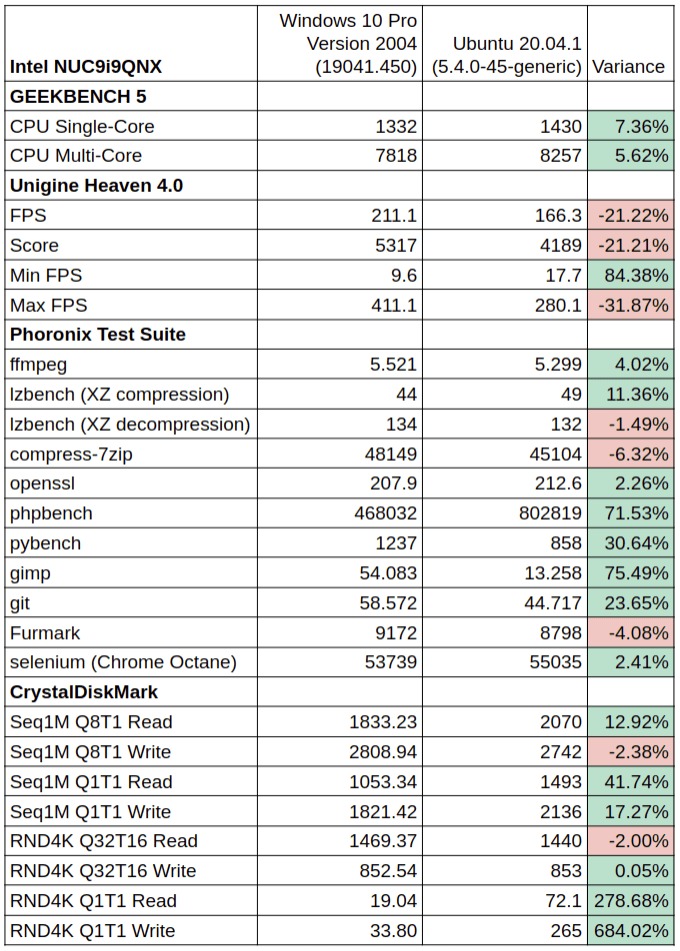 Overall, Ubuntu performs better in the majority of the benchmarks than Windows with the exception of Unigine Heaven. A good example is the Blender benchmark above where Windows needed overclocking to match the Ubuntu result.
However, as demonstrated by the gaming performance under Windows and in video playback which is limited by the Nvidia graphics not fully supporting all codecs for hardware acceleration in Ubuntu, Windows the OS of choice for these types of activities.
Power consumption is higher in Windows when gaming although watching videos is best performed in Windows where power consumption is lower and without frame skips.
Finally, there are a lot of tools in Windows to support overclocking of both the CPU and GPU, and due to the limited functionality provided by the BIOS overclocking is easier to perform in Windows, at least for a novice.
Networking
Network connectivity throughput was measured on Ubuntu using “iperf”:
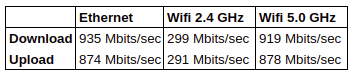 The wifi results are excellent due to Wi-Fi 6 and the 5.0 GHz speeds were similar to ethernet speeds although it must be noted that the router was only a meter away from the NUC.
BIOS
The BIOS is quite restricted. There isn’t any control over setting the memory speed which defaults to its highest setting. Overclocking is also very limited with just a few power limit settings. A brief overview is available in the following video:

NUC9i9QNX Cable Management
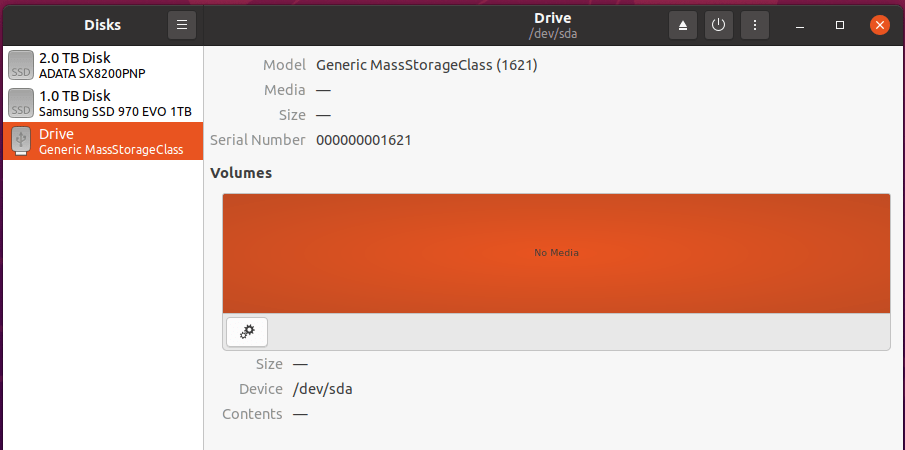
As alluded to earlier, cable management is reasonably challenging although not dissimilar to building in mini-ITX cases. However, care needs to be taken to ensure all cables remain connected when adding or removing the GPU or Compute Element. When I first tested the replacement NUC9i9QNX I didn’t realize that the SDXC card was not working. I had noticed that the “Generic MassStorageClass” device occupying “/dev/sda” in Ubuntu was missing without realizing the implication:
Stripping down the NUC9i9QNX again I saw that the lower USB cable appeared not to be fully inserted:
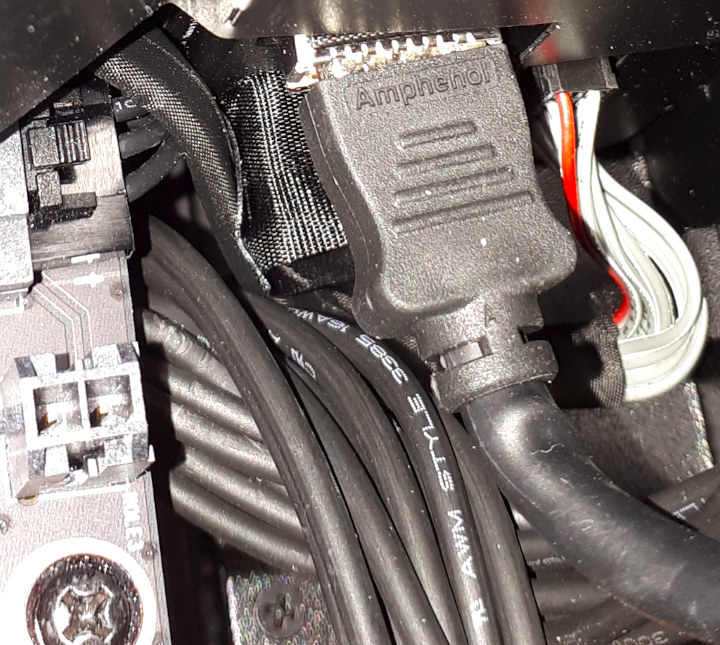
Reseating the cable fixed the issue.
Final Observations
Much has been said regarding the price of NUC 9 devices. However, recently I’ve seen substantial discounts being offered by local resellers. For example, my first NUC cost AUD 2399 whereas my replacement only cost AUD 2099. Now at the time of writing some local resellers are offering it for AUD 1884. Such a fluctuation in prices cannot be a good sign and obviously unfair to early adopters.
Being cheaper also does not necessarily overcome the NUC’s current shortcomings: incorrect NVMe speeds, inability to control the memory speed, issues with running Ubuntu 20.04, and inability to overclock through the BIOS all substantially detract from making this device recommendable.
There are also several unknowns about the whole Compute Element concept. Intel has dropped the compute stick and the compute card and so doesn’t have a particularly strong track record for “compute” products. Other issues to consider are whether AIB partners will continue to release the required shorter graphics cards. Or whether the current 500 W power supply will be sufficient to support new graphics cards like the RTX 3000 series.
The concept of replacing the Compute Element with a more updated version after a period of time may not be realistic if everything else has become outdated like cooling or cable connectors and there is always the possibility that AMD will offer a more attractive alternative.
Despite these negatives, the form factor is still likable and the device is well engineered. Overall this is a powerful mini PC and the flexibility of adding a discrete graphics card overcomes the primary limitation of the current mini PC form factor. If the highlighted issues can be fixed then this will be an exceptional mini PC.

Ian is interested in mini PCs and helps with reviews of mini PCs running Windows, Ubuntu and other Linux operating systems. You can follow him on Facebook or Twitter.
Support CNX Software! Donate via cryptocurrencies, become a Patron on Patreon, or purchase goods on Amazon or Aliexpress. We also use affiliate links in articles to earn commissions if you make a purchase after clicking on those links.


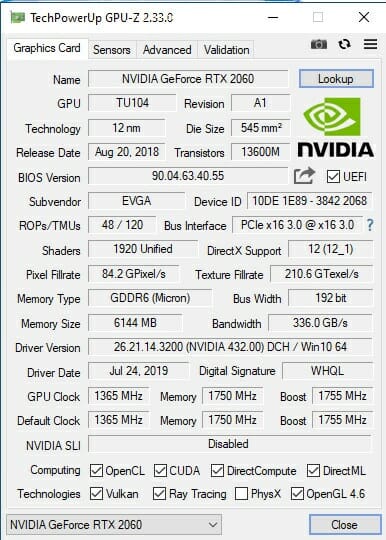
While I did not read the article in its entirety (TLDR), the screen shot of your graphics card may yield a clue as to the nature of the slow NVMe SSD issue. The graphics card is reported as PCIe 3.0 capable (8 GT/s), but the link established is PCIe 1.0 (2.5 GT/s).
You can check the PCIe link speed of your NVMe SSD in Linux using the ‘sudo lspci -vv’ command. Search for “LnkSta:” in the output.
Thanks. However the NVMe SSD Controller shows:
linuxium@NUC9i9QNX:~$ sudo lspci -s 6f:00.0 -vvv | grep LnkSta
LnkSta: Speed 8GT/s, Width x4, TrErr- Train- SlotClk+ DLActive- BWMgmt- ABWMgmt-
LnkSta2: Current De-emphasis Level: -6dB, EqualizationComplete+, EqualizationPhase1+
Numbers are nice and all but I think we all know what people need to know.. does that skull have tasteless RGB LED effects?
No as the skull is just “painted” on the side panels.
The carrying case mimics the RGB LED effects when viewed under ultraviolet light … see https://twitter.com/linuxium/status/1310811257281286146
@cnx-software – what router do you use so you get almost 1gbps on wifi ?
A WiFi 6 one (ASUS RT-AX88U) to make use of the NUX9i9QNX’s (802.11ax) integrated Intel Wi-Fi 6 AX200 (Gig+) adapter.