The Green Metrics Tool (GMT) is an open-source framework that allows the measurement, comparison, and optimization of the energy consumption of software with the goal of empowering both software engineers and users to make educated decisions about libraries, code snippets, and software in order to save energy along with carbon emissions.
While the firmware of battery-powered embedded devices and the OS running on your smartphone are typically optimized for low power consumption in order to extend the battery life, the same can not be said of most software running on SBCs, desktop computers, and servers. But there are still benefits of having power-optimized programs on this type of hardware including lower electricity bills, a lower carbon footprint, and potentially quieter devices since the cooling fan may not have to be turned on as often. The Green Metrics Tool aims to help in that regard.
The developers explain how that works:
Any application will be containerized and then analyzed by its logical parts. The open-source tool measures classical performance metrics as well as energy-related metrics like wattage, temperature, and cooling efficiency to understand what part of the software is responsible for which part of the energy consumption.
Through the concept of usage scenarios, we create an interface for developers to test/develop against. In the end, this makes complex software products comparable to each other and thus enables developers to select libraries based on their functionality-energy-profile (for instance messages per Watt or similar).
Green Metrics Tool requires a Linux host, and it looks interesting enough, so I tried to install it on Ubuntu 20.04 and 22.04 . I followed the installation instructions starting on my laptop running Ubuntu 20.04 with the following command installing some dependencies:
|
1 2 3 4 5 6 7 |
sudo mkdir /var/www sudo chown $USER.$USER /var/www -R git clone https://github.com/green-coding-berlin/green-metrics-tool /var/www/green-metrics-tool sudo apt update sudo apt upgrade sudo apt install make gcc python3 python3-pip libpq-dev sudo python3 -m pip install -r /var/www/green-metrics-tool/requirements.txt |
The next step was to install Docker:
|
1 2 3 4 5 6 |
curl -fsSL https://download.docker.com/linux/ubuntu/gpg | sudo gpg --dearmor -o /usr/share/keyrings/docker-archive-keyring.gpg echo "deb [arch=$(dpkg --print-architecture) signed-by=/usr/share/keyrings/docker-archive-keyring.gpg] https://download.docker.com/linux/ubuntu $(lsb_release -cs) stable" | sudo tee /etc/apt/sources.list.d/docker.list > /dev/null sudo apt update sudo apt remove docker docker-engine docker.io containerd runc sudo apt install ca-certificates curl gnupg lsb-release sudo apt install docker-ce docker-ce-cli containerd.io docker-compose-plugin |
We can verify docker is installed and running properly by typing:
|
1 |
sudo docker stats |
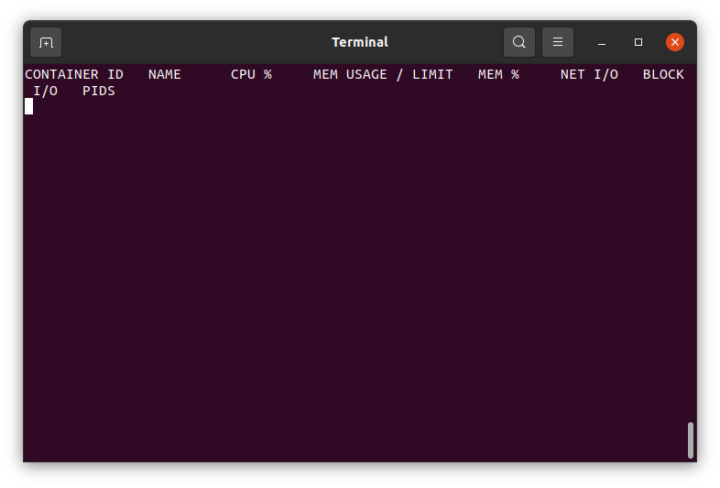
It will output a view with container-id, name, and stats, which are all empty for now.
I had to run the command with sudo, but GMT is designed to work only with Docker in rootless mode, and I had to install a few more packages:
|
1 2 3 4 5 |
sudo systemctl disable --now docker.service docker.socket sudo apt install uidmap sudo apt update sudo apt-get install -y docker-ce-rootless-extras dbus-user-session dockerd-rootless-setuptool.sh install |
It ends with:
|
1 2 3 4 5 |
[INFO] Make sure the following environment variables are set (or add them to ~/.bashrc): export PATH=/usr/bin:$PATH Some applications may require the following environment variable too: export DOCKER_HOST=unix:///run/user/1001/docker.sock |
So I edited ~/.bashrc accordingly by adding the two export lines.
Lastly please run the following commands to have the docker daemon always lingering:
|
1 2 |
systemctl --user enable docker sudo loginctl enable-linger $(whoami) |
cgroup2 support must also be enabled. It is enabled by default in Ubuntu 21.10 and greater, but since I’m still on Ubuntu 20.04, I had to enable it manually along with CPU, CPUSET, and I/O delegation as explained on rootlesscontainer.rs. To enable cgroup2, I had to create the file /etc/default/grub.d/50-cloudimg.settings.cfg with the line:
|
1 |
GRUB_CMDLINE_LINUX="systemd.unified_cgroup_hierarchy=1" |
Then update the grub configuration with:
|
1 |
sudo update-grub |
To enable the delegation, I had to run a few more commands:
|
1 2 3 4 5 6 |
$ sudo mkdir -p /etc/systemd/system/user@.service.d $ cat <<EOF | sudo tee /etc/systemd/system/user@.service.d/delegate.conf > [Service] > Delegate=cpu cpuset io memory pids > EOF $ sudo systemctl daemon-reload |
Once this is done, I had to reboot my computer and could verify everything is setup as expected:
|
1 2 3 4 |
$ ls /sys/fs/cgroup/cgroup.controllers /sys/fs/cgroup/cgroup.controllers $ cat /sys/fs/cgroup/user.slice/user-$(id -u).slice/user@$(id -u).service/cgroup.controllers cpuset cpu io memory pids |
The last step was to run the install script to configure the database, create a few files, install even more dependencies, and build the Metric Providers:
|
1 2 |
cd /var/www/green-metrics-tool/ ./install.sh |
I had a couple of errors: “g_string_replace” undeclare and the sgx binaries would not build because the directory is empty. The first error only happens in Ubuntu 20.04, and not Ubuntu 22.04, and it looks like it may be a new function in glibc, and the second happens in both, so I just comment that part out to complete the build. We can now run the Docker container with:
|
1 2 |
cd docker docker compose up |
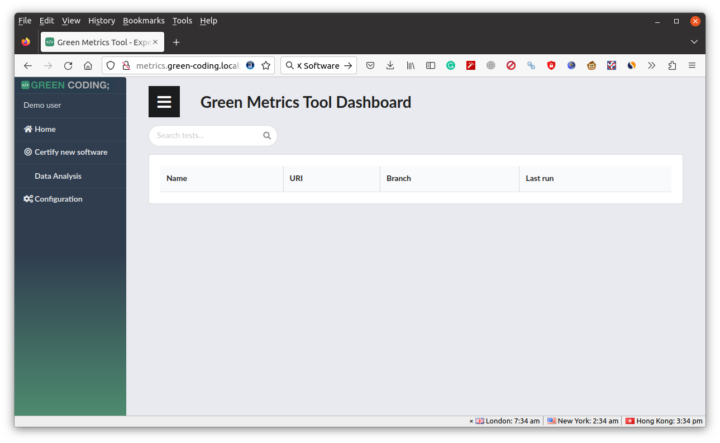
It took around 20 minutes to build the docker image and I can now access the dashboard at http://metrics.green-coding.local:9142/index.html
The Green Metrics Tool supports various Metric Providers in C or Python that measure power consumption (powerstat), report various CPU usage metrics, gather data for lm-sensors, leverages the Running Average Power Limit (RAPL) interface for CPU and memory energy usage, and so on.
The Green Metrics Tool supports various Metric Providers in C or Python that measure power consumption (powerstat), report various CPU usage metrics, gather data for lm-sensors, leverage the Running Average Power Limit (RAPL) interface for CPU and memory energy usage, and so on. But after looking into GMT documentation the learning curve may be longer than I initially anticipated, and I noticed a public demo is already running with various tests available. So let’s check out the output from the first project: “Fujitsu TX1330 M2 – Stress-Interval with powerspy”.
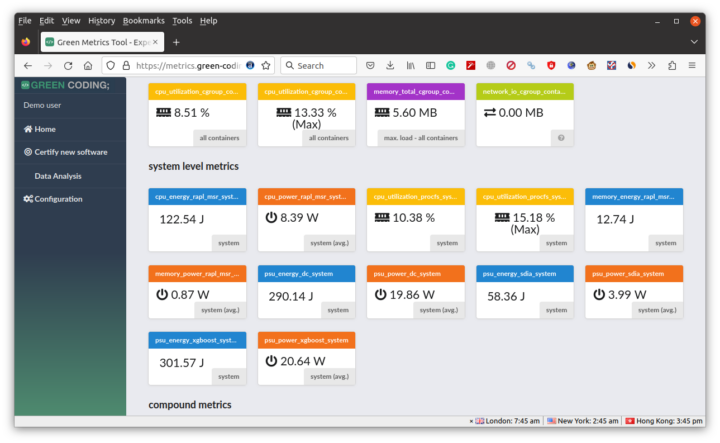
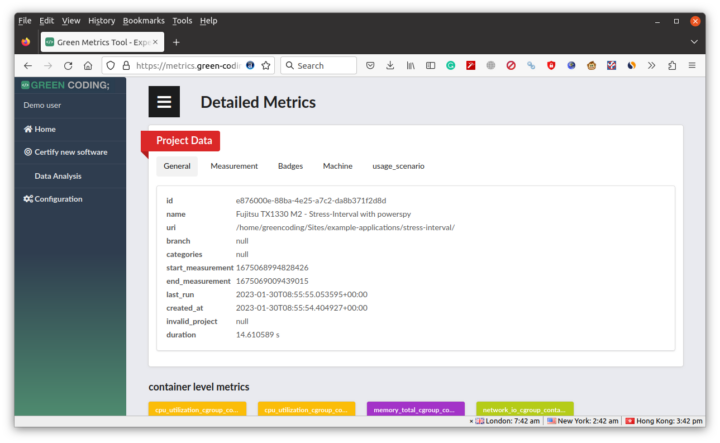 We can see some information about the project and its duration, and if we scroll down we have widgets with various “system level metrics” followed by compound metrics.
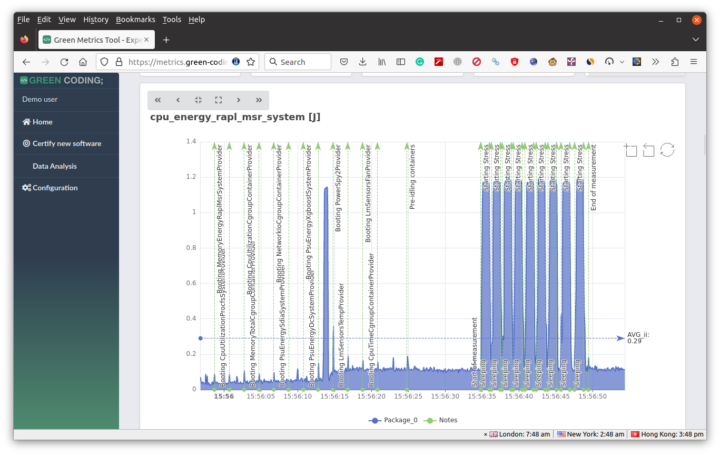
Scrolling further we have a range of charts for each metric such as the CPU energy usage over time.
Analysing the data also requires some expertise and time to learn, and if you want to check some practical results, the developers have written about a few case studies with different image file formats, WordPress vs Hugo, etc… If your software is located in a public repository on GitHub and you’ve done some optimizations, it will eventually be certifiable based on various schemas such as Green-Coding-Berlin, Blue Angel (Blauer Engel in German) and SCI from the Green Software Foundation.
You’ll find the source code of the experimental software and more details on the GitHub repo. You may also want to attend Arne Tarara’s FOSDEM 2023 presentation entitled “Green software engineering” where he will give an overview of the tool and present the roadmap with eventually the goal of having “a public and open database of energy information for arbitrary hardware setups, code blocks, and libraries and a green standard library/green code completion”.

Jean-Luc started CNX Software in 2010 as a part-time endeavor, before quitting his job as a software engineering manager, and starting to write daily news, and reviews full time later in 2011.
Support CNX Software! Donate via cryptocurrencies, become a Patron on Patreon, or purchase goods on Amazon or Aliexpress



“Green Software” is bullshit, most of the CO2 emissions are in the production of hardware, not in the electricity consumed by the devices.
You can lead a horse to water but you can’t make it drink…
Excellent overview, I’ll try as soon as possible! Actually I daily use Scaphandre to track servers and applications power consumption : https://github.com/hubblo-org/scaphandre
I agree CO2 is not a good metric, only Watts matter, because depending of the country you host your application CO2~Watts is different!
> only Watts matter
And I already wondered how this could be measured with this ‘Green Metrics Tool’ on HW that lacks any such measuring capabilities. Turns out just as with Scaphandre this is blindly trusting into software –> powercap/rapl
“RAPL is not an analog power meter, but rather uses a software power model. This software power model estimates energy usage by using hardware performance counters and I/O models”
Intel: “RAPL is an interface for reporting accumulated energy consumption of various system-on-chip (SoC) power domains.” As stated here there are power monitoring circuits in the machine, it’s not an out-of-air estimation 🙂 RAPL uses hardware probes and is actually very accurate (tested with a powermeter). One must not forget that it only provides partial results, e.g. it does not include cooling, but apart from that it’s actually quite good! Note that on recent hardware it gives more information (i.e. there are more components that are monitored), for instance on my laptop there’s a RAPL domain that coincides with the… Read more »