
While it’s possible to do monitoring with tools like RPI-Monitor on headless or remote systems, top and htop are likely the commonly used tools to monitor CPU and process usage in the terminal. There’s now a new and different option with the Stress Terminal UI that display pretty charts for frequency, CPU usage, and temperature in the terminal, and as its name implies it can also stress the system.
 I’ve first installed it in my main computer running Ubuntu 16.04.2 as follows:
|
1 |
sudo pip install s-tui |
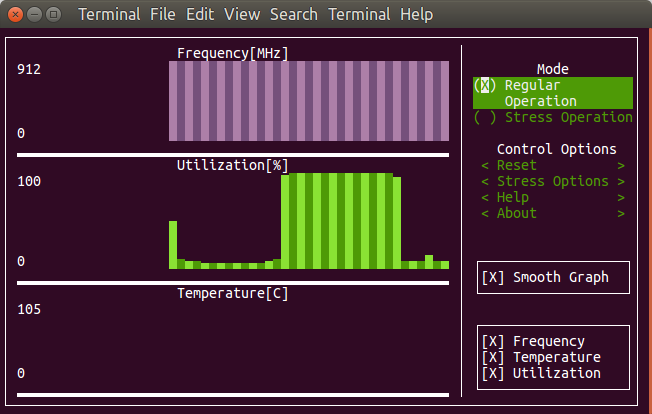
and then just started it
|
1 |
s-tui |
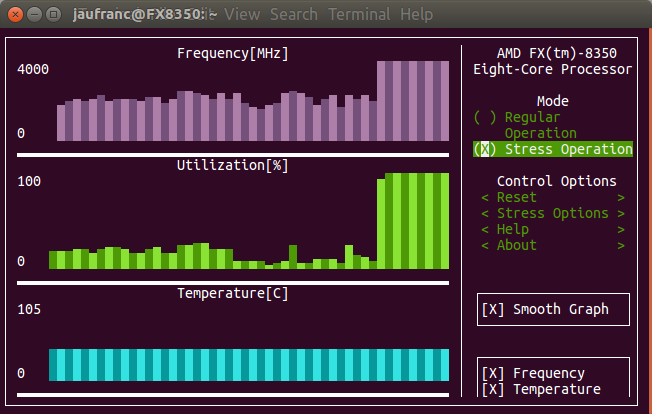
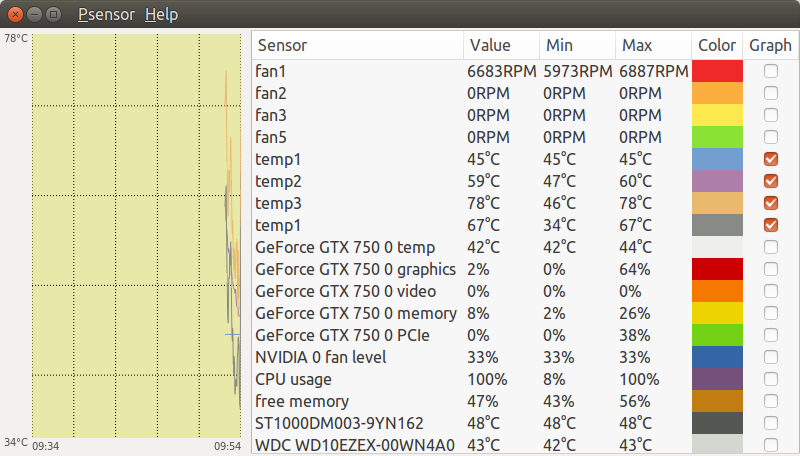
It took the screenshot above after enabling stress operation for a few seconds, and while frequency and CPU utilization in percent are updated properly, temperature is not, at least on my system. I had to enable “Smooth Graph” option to see any changes in the first two charts. I tried to run the app again with sudo, but still no temperature update, and that’s because the program is confused since I have two “temp1” values in my machine, one for “it8720” that will always show a constant temperature (45 °C) and one for “AMD CPU” that will vary depending on the load.
A good solution would have to have an option to select the sensor, but there’s no such option for s-tui right now:
|
1 2 3 4 5 6 7 8 9 10 11 12 13 14 15 16 17 |
s-tui --help usage: s-tui [-h] [-d] [-c] [-t] [-j] [-v] ********s-tui manual******** Usage in graphical mode: * Toggle between stressed and regular operation using the radio buttons. * If you wish to alternate stress defaults, you can do it in 'stress options * If your system supports it, you can use the utf8 button to get a smoother graph * Reset buttons resets the graph and the max statistics optional arguments: -h, --help show this help message and exit -d, --debug Output debug log to _s-tui.log -c, --csv Save stats to csv file -t, --terminal Display a single line of stats without tui -j, --json Display a single line of stats in JSON format -v, --version Display version |
I switched to an ARM platform, namely NanoPi NEO board:
|
1 2 3 4 5 6 7 8 9 10 11 12 |
sudo pip install s-tui Collecting s-tui Using cached s-tui-0.5.0.tar.gz Complete output from command python setup.py egg_info: Sorry, Python 3 is not supported Please try: pip2.7 install s-tui --user or: sudo pip2.7 install s-tui ---------------------------------------- Command "python setup.py egg_info" failed with error code 1 in /tmp/pip-build-oddptczf/s-tui/ |
So it does not work with Python 3, and requires Python 2.7. Let’s give it another try:
|
1 2 3 4 |
wget https://bootstrap.pypa.io/get-pip.py sudo python2.7 get-pip.py sudo apt install python2.7-dev sudo pip2.7 install s-tui |
I could install it and run it, but only CPU and temperature charts would be drawn.
 The temperature sensor may have not been detected due to the following error:
|
1 |
modprobe: FATAL: Module msr not found. |
msr appears to be be something called “model-specific registers”, and only used for x86 CPU, so ARM detection did not work or was not performed here. The developers did test the program successfully with a Raspberry Pi 3 board however. He’s also aware of issues with temperature sensors:
If the temperature does not show up, your sensor might not be supported. Try opening an issue on github and we can look into it
So overall, it’s still work in progress. Support for showing info for multiple cores would be nice, but probably only suitable in a full screen terminal.
Via It’s FOSS

Jean-Luc started CNX Software in 2010 as a part-time endeavor, before quitting his job as a software engineering manager, and starting to write daily news, and reviews full time later in 2011.
Support CNX Software! Donate via cryptocurrencies, become a Patron on Patreon, or purchase goods on Amazon or Aliexpress. We also use affiliate links in articles to earn commissions if you make a purchase after clicking on those links.


Pretty. If it had a toggle-able top menu (like htop) it would get a permanent Ctrl+Alt+1 virtual console on my servers and workstations 🙂
I tried it on one of the slowest servers we use (Lime2 with dual-core A20 limited to 960 MHz). I get the same
But temperatures were reported correctly. Also the tool is lightweight enough to not change system behaviour (that’s a huge problem with most usual monitoring solutions when running on embedded devices: the daemons collecting data being too aggressive and by starting to monitor the whole system behaviour changes… eg. CPU cores now running constantly at the upper clockspeed).
Me monitoring the monitoring (s-tui picking the wrong one: PMIC instead of SoC) 😉 and searching for available ‘sensors’:
Thank you for the input. We are hard at work addressing the issues you have mentioned
@Alex
In case you want to support a couple of dev boards properly please be aware that thermal readouts also depend on kernel version (for many SBC more than one kernel variant exists, eg. the very popular Orange Pi can run a smelly 3.4 kernel but also latest and greatest mainline — sysfs node to readout temperature is the same with both kernels but with legacy you get degrees and with mainline kernel millidegrees instead).
In Armbian wrt CPU/SoC temperature it’s basically this to get the proper SoC temperature sysfs node and that to interpret the value properly (tested on +50 SBC with up to 3 kernel variants per board).
In the last link starting at line 268 you could also see how to deal properly with big.LITTLE boards (big and little cores can clock at different clockspeeds, but on all devices we know it’s a single cpufreq per cluster, so it’s only needed to check cpu0 and cpu4 but since in the meantime there are also SoCs using 2 big and 4 little cores — eg RK3399 — it would be cpu0/cpu2 there. So checking /proc/cpuinfo at start seems to become mandatory in the future to properly display clockspeeds of different ARM CPU core clusters)
I get “IOError: [Errno 61] No data available” … so I created an issue on Github …
We have just released a new version. You can now select a temperature sensor manually, as was suggested in this post. Hopefully in the future all the sensors will be availableh in the TUI
@Alex
Thanks for the update, I could use custom temperature as follows.
I could also playu with it8720 temperature values using 0,1 or 2:
I can see you have a new option for power, but it does not work on my machine (desktop PC), it just shows N/A. In the list of sensors I have “power1”.
@cnxsoft
Glad to hear it worked out for you.
The power read is currently only available on >= Intel 2nd Gen CPUs. If there is a way to get the this data for AMD/ARM systems, we would like to hear suggestions/receive pull requests.
I believe the power sensor that shows up is of your graphics card and not of the CPU.
If I’m wrong, it should be possible to integrate it in the next version
@Alex
I did not investigate in details at the times, and while the “PCI” in the string would certainly lead us to think it’s about the GPU, it’s actually the power of AMD CPU. Documentation about fam15h_power -> http://elixir.free-electrons.com/linux/latest/source/Documentation/hwmon/fam15h_power
@cnxsoft
Looks promising. The only problem now is to get access to an AMD system.
Newest version supports python3