
[Update May 7, 2019: Giggle Score has been updated to use 7-zip to benchmark the boards instead of sysbench, and the “best value” rankings are now quite different]
People like to compare single board computers, and usually want to have a simple answer as to which is better than the others. But in practice it’s impossible, because the beauty of SBCs is that they are so versatile and can be used in a wide variety of project, and that means in some cases the “best board” may be completely useless to you since it lacks a critical feature and interface for YOUR project be it H.265 video encoding or a MIPI DSI display interface.
Still, it’s still always fun to look at benchmark scores and trying to compare SBCs, and for projects that mostly require CPU processing power it may also be useful. Robbie Ferguson has been developing and maintaining NEMS (Nagios Enterprise Monitoring Server) Linux for single board computers which runs an after-hours benchmark once per week and logs the server’s score anonymously and securely meaning he has a database with benchmark of hundreds boards running NEMS, mostly of which are Raspberry Pi 3 Model B/B+ boards.
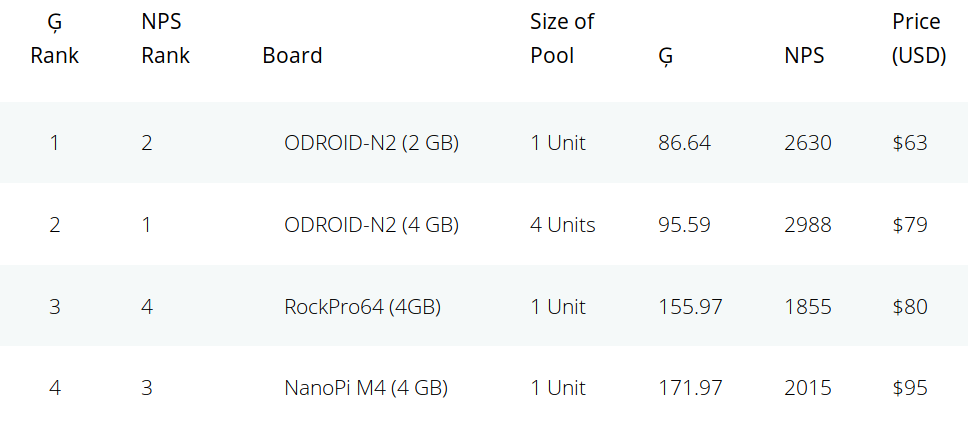
The NEMS Performance Score (NPS) is then weighted by the selling price of the board to derive the Giggle Score providing a list of the boards with the best value. As the name implies, you may not want to take it too seriously but the results are in and Amlogic S922X based ODROID-N2 board with 2GB RAM is the board with best value, followed by the 4GB RAM version, and RockPro64 (4GB) comes in third.
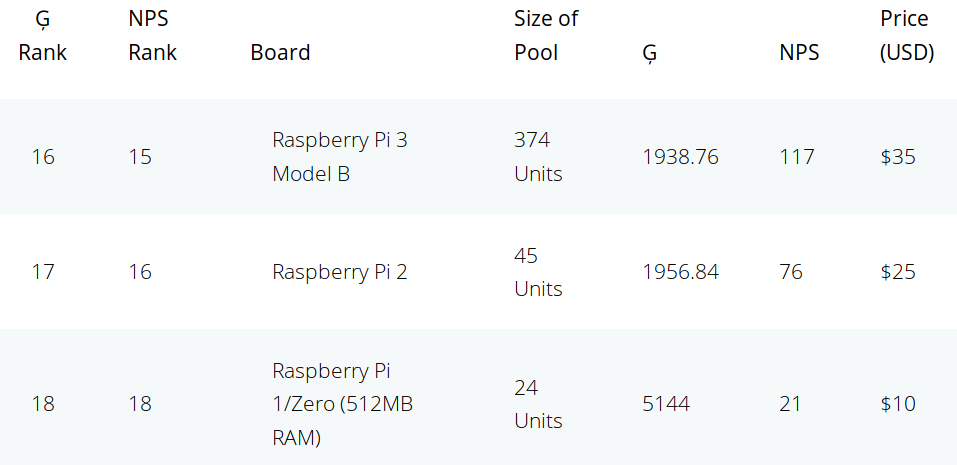
At the other end of the ranking, the three boards with the worst value are all coming from the Raspberry Pi Foundation with Raspberry Pi 3 model B, Raspberry Pi 2, and Raspberry Pi 1/Zero being dead last.
If networking monitoring is indeed a low CPU usage task, the Raspberry Pi Zero may ironically be the best value at $10 for running NEMS Linux, as all the processing power potentially delivered by ODROID-N2 may be just be wasted since the system may be idled at most times. I’d assume it all depends on the size of your network.

Jean-Luc started CNX Software in 2010 as a part-time endeavor, before quitting his job as a software engineering manager, and starting to write daily news, and reviews full time later in 2011.
Support CNX Software! Donate via cryptocurrencies, become a Patron on Patreon, or purchase goods on Amazon or Aliexpress. We also use affiliate links in articles to earn commissions if you make a purchase after clicking on those links.


Shell script that runs sysbench…Why not just call it sysbench score?
Why not call it ‘benchmarking gone wrong’ or ‘collection of numbers without meaning’?
The guy seems to not look at the numbers he collects and publishes. If ODROID XU4 achieves the same score as RPi 3 A+ (180) and the RPi 3 B+ then scores just 139 then you know your numbers are simply BS and should be deleted instead of being published.
We should start a performance review site together and do it correctly. You in? XD
Count me as an extra ; )
This is a sepcific use case but seems to do a fair job: http://wiki.ant-computing.com/Choosing_a_processor_for_a_build_farm
You’re right. There needs to be unbiased review site with competent, relevant benchmarks – that would cut down on the BS boards and let the good boards succeed.
There indeed seems to be something seriously wrong. This benchmark apparently favors only 6-core and 64-bit boards. The 4-core ones are way lower, and the 32-bit ones are further lower. XU4 has 4 big + 4 little in 32-bit and is completely defavored. It might be that the workload is realistic and really depends on the hardware, but I doubt it. It’s also possible that the distro and installed packages matters first. I’ve seen in the past that some workloads making intensive use of scripts could run more than twice as fast by switching to simpler shells or simply removing .bashrc and the completion stuff so as to speed up the shell startup time.
It’s simply a matter of using the wrong tool. Sysbench when used correctly can provide insights but usually sysbench is only used in ‘fire and forget’ mode by clueless people who never thought a single second about the results they get.
Sysbench’s cpu test is a number crunching application calculating prime numbers inside the CPU’s L1 caches. No dependency on memory performance at all but 100% dependency on compiler optimizations and ISA (guess why the XU4 scores are that low or why sysbench executes 15 times faster on the RPi 3 once it runs in aarch64 state? Since ARMv8 64-bit provides a division instruction that is lacking when running 32-bit).
That’s why the ’64-bit boards’ appear to be much faster: compiler utilizing division instruction.
Then sysbench depends a lot on both GCC version and on its own version number.
That’s the reason why ‘hardware gets faster’ according to sysbench after each distro version update. Since GCC version the sysbench binary has been built with got updated too and that’s responsible for better scores (at least true for sysbench 0.x versions). And if you update your sysbench from 0.4 as it was part of every distribution 2-3 years ago to sysbench 0.5 your scores drop by 30% (I measured 7.5 sec vs. 11 sec with sysbench 0.4.12 vs. 0.5 almost 3 years ago on Pine64).
The sysbench execution mode to generate this BS score (called NPS) is just crazy given the above outlined problems. Random sysbench binaries that have been built with different compilers and compiler flags will be used to generate a number that neither represents hardware performance in general and especially not for the ‘monitoring node’ use case. It’s just a BS number.
And maybe the worst part of this is how the benchmark.sh script is written. A stupid temp file vulnerability will allow any unprivileged attacker on this system to gain root privileges via /tmp/nems-benchmark.log and benchmark-parse.sh. But hey, that’s normal. I’ve not seen a single project yet that originated from the Raspberry Pi that was not a total security nightmare.
I expected to see a comment by Jerry here…
He’s probably busy learning the new propaganda material from RPi foundation 🙂
> If networking monitoring is indeed a low CPU usage task
Depends mostly on count of hosts and services you monitor and how the data is processed. With a lot of services you’re likely be bottlenecked by (integer) CPU, memory and IO performance.
The NEMS guy decided to use the least reliable benchmark for this use case in the most stupid mode: https://github.com/Cat5TV/nems-scripts/blob/master/benchmark.sh
Sysbench calculates prime numbers inside the CPU’s L1 caches. It has no relationship to the performance requirements of a Nagios monitoring host and even worse different sysbench versions spit out totally different scores while his benchmark script simply tries to fetch a random sysbench package from here or there. The results are not comparable at all and he should be aware that sysbench when running on a RPi 3 that has been brought up in aarch64/64-bit mode will perform ’15 times faster’ than when running a Raspbian/32-bit userland.
When will this sysbench madness stop?
The most amazing is that if not found he installs tons of libs on the system and builds them from source (using make -j, unbounded), then installs, then runs the tool. *This* compilation phase could have served as a hint for the board’s performance and is way more relevant to a nagios workload than what the resulting sysbench executable might produce! But the compilation time is not measured here so the only useful phase of this script it lost.
Can we agree that the only meaningful benchmarks are ones that help predice the performance of the app we care about? So, here’s someone with an app and his ‘benchmark’ isn’t even testing the performance of his app. I mean, really, here you are writing an app and you don’t use critical bits of the app as a benchmark? That’s just *facepalm*
For this type of ‘app’ there’s really no need to benchmark individual SBC. It’s more important to educate users about what bottlenecks a Nagios install so they know where to spend their money on.
Obviously there’s some CPU horsepower needed (Integer not floating point). For this type of use case I consider 7-zip’s benchmark mode still sufficient. If a
7z brun scores twice as high on board A compared to B then A will be able to monitor roughly twice as much services than B as long as storage requirements are also met. And that means sufficient sequential and also random IO performance for the RRD databases.So it’s important for users to realize that an ODROID N2 for example features both a really fast eMMC interface and an SD card interface that is UHS/SDR104 compatible (allowing for faster sequential transfers as well as higher IOPS) while any RPi is quite limited here. But the board’s capabilities are useless if users are not aware of SD card limitations. They need to purchase SD cards compliant to A1 performance class instead of looking at the old speed classes like ‘Class 10’ that only deal with sequential transfer speeds (partially irrelevant for the use case). An ODROID N2 running off a crappy SD card with horribly low IOPS at low block sizes can be outperformed by a RPi with a SanDisk Extreme Plus A1 even if ‘Giggle Score and NPS’ tells the opposite.
IMO it’s about educating users so they can choose the right combination of board and storage and not inventing a totally misleading ‘performance indicator’ made with a tool that’s 100% useless for the use case in question and provides only BS numbers especially when comparing ARM 32-bit vs. 64-bit.
Thank you. This is a much more productive post. I was looking at 7zr b as a possible benchmark to include, so it’s good to see a bit more details about why this would be beneficial.
Nobody has submitted a PR, but this certainly helps. Watch for some new commits to improve the accuracy based in part on your feedback.
Thank you.
Robbie // The Bald Nerd
I opened up a Github issue pointing back to the discussion here: https://github.com/Cat5TV/nems-scripts/issues/2
I’d argue that as far as ARM boards go, the Jetson Nano Developer Kit offers even better value than the odroid-N2 when one takes into consideration its 4GB of RAM, GPU and AI hardware and Nvidia support.
Not CPU-wise – N2 is a clear winner there. GPU-wise they’re comparable; of course if one needs CUDA Nano has no alternative.
First off, thank you Jean-Luc for taking notice of my little project.
I’ll try to answer as many comments as possible.
The intention behind the Giggle Score is not really to compare a RockPro64 to a Raspberry Pi Zero. As noted in the post, a Pi Zero might be the perfect SBC for your project even though its Giggle Score shows it as expensive for the performance it provides. BUT it is still only $10 USD! Giggle Score doesn’t say it is expensive: It says it is providing less performance for its price. If it meets your needs, it may be the right board.
My intention is to simply supplement what you already know regarding the benchmarks of each board by offering a reasonable value comparison. Sort by price and we can see that for only $1 more, I could go with an Orange Pi Zero and get more value for roughly the same money. But then it is up to me, armed with that knowledge, to go look at benchmarks, read reviews, check if the board has the GPIO I need (and if I’m not a developer, does it have the software I need?). Giggle Score is just one extra piece to add to the process. It is not a benchmarking tool.
A Giggle Score can only be useful when compared one to another. What I saw as being a useful tool is providing a single number (Giggle Score) that provides a way of gauging the value per USD of each board tested. Not very scientific, but useful. Yes, I’m sure there are flaws or ways I can improve things–and I will. This is a young project, and really, just a lot of fun.
I am disappointed at the handling of this by some commenters. Let’s be constructive. Were I some young kid developing his first tool and thinking it would be great to give back to the community and this was its response, I’d be crushed. You are so much better than this.
I’ll take each comment constructively, and I both appreciate and admire the knowledge of the commenters here.
Regarding /tmp… you’re being alarmist, but you’re right in this: It would indeed be better practice to move this operation away from a user-accessible folder. I’ll make that change just for good practice sake, thank you. The script linked to is not a user script. This is a component of a single-purpose distro that runs as a dedicated server appliance on a LAN with a single privileged user. The injection that you specify would require the user know the admin’s credentials, which in itself would allow them to do anything they want anyways.
Regarding comments such as “sysbench score” or “benchmarking gone wrong”, a Giggle Score and NPS are not intended to be used as benchmarks. I’ll improve the descriptions on the site because I can understand this being confused and at one point I even call NPS a benchmark. These are [arbitrary but comparable] scores that, since each test is the same on each board, can only be compared one to another, and their accuracy only exists because of the controlled way the tests are initiated.
Yes, there appears to be something strange surrounding the ODROID-XU4, which I will investigate. I’m working toward offering a Giggle Score that is as accurate as possible, and part of that process will mean working out kinks (and possibly bugs), and hearing from users like you with constructive ideas and suggestions.
I moved to Sysbench because it provides a lightweight means of testing a lot of boards fast. I’m not set on Sysbench, and that is why as of yet, it is not listed on the site. I had, at one point, used Phoronix Test Suite, and while it is excellent, it was too hard on some of the lesser SBCs. But again, Giggle Score is not a pure benchmark in the traditional sense. As long as the same tests are performed, and the same numbers compared for each board, the comparison should prove reasonably accurate. I will explore ensuring the same version of Sysbench is used across all boards.
Giggle Score is not an app benchmark.
I can only test what I have on hand. I may look at the Jetson Nano sometime. I try to add a couple new SBCs each month.
Thanks everyone. I do hope you will see a purpose and use for GiggleScore.com – I think it’s a fun idea, and I’m willing to put the work in to make it as good as possible.
Robbie // The Bald Nerd
> As long as the same tests are performed, and the same numbers compared for each board, the comparison should prove reasonably accurate
Absolutely not (read the reasons above, everything is already explained in detail — sysbench’s cpu test is great for people calculating prime numbers for a living but has absolutely nothing to do with any real-world application and especially a Nagios host).
I appreciate your knowledge, and I’m sure there is a suggestion in here somewhere and not just bashing sysbench (which is a great tool) and me (also a great tool). What CPU test would you prefer see part of the Giggle Score algorithm (which is not a benchmark)?
Amen to this. I see tkaiser posting a lot of problems but zero solutions. As someone who is just getting into the sbc game it would be good to know which test(s) he thinks is most relevant to getting a meaningful baseline.
> I see tkaiser posting a lot of problems but zero solutions.
This is not exact. He proposed a few times 7z as one candidate. I’m personally not completely fond of this one either but I admit that it will depend on CPU, the memory controller and RAM performance at least, which is already much better than just integer divisions which are only relevant in specific number crunching applications. The ratios between the high-end and the low-end results here are definitely misleading and while they possibly place the top and bottom at their right place, the intermediary ones are not necessarily well placed, and they are likely the ones most people will want to buy due to a good price/performance balance.
> bashing sysbench
Seriously, if this is your impression I can’t help you. Sysbench when used correctly can be used to determine the performance of specific database servers (that’s where it comes from). The problem is the mode people use it: without thinking a second what the sysbench tests really do.
Care to explain how it’s possible that a RPi 3 when running Raspbian (32-bit) scores 15 times lower compared to running a 64-bit Debian? Why upgrading an RPi from Jessie to Stretch results in faster sysbench scores? Why using a different sysbench version (differing by the 2nd decimal point) results in 30% ‘performance difference’?
It’s the ‘fire and forget’ mode people are using benchmarks that’s the problem while an active benchmarking approach is needed to get why a specific install performs as it performs!
And no, there’s of course no other ‘CPU test’ that is better since use case first! Always!
For the use cases I’m interested in using 7-zip’s benchmark is a good approach to estimate ‘server performance’, that’s why I developed sbc-bench also relying on this tool after years of extensive tests (to ensure that this benchmark doesn’t suffer that much from compiler version or switches used!). But the results need to be taken with a huge grain of salt (and as such the footnotes over at the results collection are the most important information) and these results only apply to situations where users are interested in ‘server workloads in general’ (that’s multi-threaded workloads, focusing on integer performance and also memory performance). For the vast majority of SBC users these numbers are plain BS. Use case first 🙂
> Giggle Score algorithm (which is not a benchmark)
Sorry, which algorithm are you referring to? You use one specific application benchmark called sysbench in an absolutely questionable way to generate some sort of ‘hardware performance’ indicator. And then you factor in a hypothetical list price which has rather limited meaning if you compare real prices with list prices for majority of users in this world (talking about well known additional costs like shipping, VAT/taxes, necessary accessories like an additional PSU since Micro USB is crap and so on).
I spent some time today to explain why using sysbench to compare SBC in the way you (and 99.9x of the other sysbench users) do is problematic. And while some other benchmarks might provide a more accurate means of ‘hardware performance’ it’s still wrong to ignore ‘use case first’.
A SBC user wanting a light ARM desktop has to look for totally different performance criteria and tweaks than someone who wants to use a SBC as NAS, server, build farm or Nagios monitoring host. The important part is educating users and not generating more numbers without meaning.
Hi. I review SBC’s, and once made a video about benchmarking tools for SBC’s. I show there that sysbench uses different versions, and performs differnt on armhf and arm64. It is not reliable to compare sbc’s with each other. And it isn’t a useful test. Here is my video.
https://www.youtube.com/watch?v=EZMHo3bVnOo&t=156s
I find your findings very misleading. They take nothing else in account. For example, the N2 doesn’t have wifi, only 1 lane USB3 no PCIe/SATA/M.2. Compared to the NanoPi M4 it lacks behind in all these things.
The list is also very limited. The NanoPi Fire3 for example would have blown everything out of the water. It’s as fast as the N2 for half the cost. It doesn’t tell anything about SBC’s and only gives people a wrong opinion about SBC’s.
But that’s my opinion. Greetings.
NicoD
Nico, your video is nice, hopefully it will teach some people how numbers alone are meaningless until you put them in their context. I noticed two things that you will possibly be interested in taking into account for a future series of tests :
– you place a fan on all your boards to prevent them from throttling, this is great for people like a few of us who are willing to invest on cooling to get the highest performance, but it’s not accurate for most users who will simply use the board inside its enclosure. For example an RPi 3B will almost instantly throttle if you use all cores but I managed to get an Odroid C2 to build a complete kernel without throttling at all. So for most users this measure (factory cooling) is useful. It will also show to other users if it’s worth investing in cooling or not.
– some of your tests (like gimp) run in graphics mode. The memory performance will directly depend on the screen resolution because the video output steals a lot of memory bandwidth and creates artificial latencies. It’s useful to try as best as you can to use all of them at the same resolution and to indicate in the tests if they were run in graphics or text modes. And it’s not that black or white, because some boards will change the DRAM performance profile when switching to graphics mode. This was the case with some RK3288 for example where in order to get the highest performance it was needed to turn off the video output and manually turn the DDR3 controller to the profile corresponding to high screen resolution!
Just my two cents 😉
You think a 1.4GHz 8xA53 is going to be faster than 1.8GHz 4xA72 and 1.9GHz 2xA53? The former with no cooling and the latter with a massive heatsink? The former with 1GB of slow DRAM and the latter with 4GB of fast DRAM?
What’s your benchmark? Because it can’t be anything that requires fast single core or multi-core CPU. It can’t be something that depends on memory speed. It can’t be anything that requires fast storage access. Maybe the benchmark is interfacing to a variety of LCD displays as that seems to be something the NanoPi Fire3 is good at.
It depends. After having tried a program called cpuminer to test my boards stability under extreme heating, I noticed that some algos were more sensitive to CPU frequency than architectural optimizations and were running at almost the same speed on the A72 as on the A53. Anything using crypto or CRC is mostly sensitive to frequency. In this case having 8 cores simply is faster than 6 cores. And the difference is not bad as can be seen in the numbers I reported here after testing on various boards : https://github.com/bschn2/rainforest/issues/15#issuecomment-488729894
As you can see, the NanoPI Fire3 at 8×1.6 GHz is 70% faster on this test than the M4 (RK3399 at 2xA72@2.0 + 4xA53@1.5) and still 15% faster than this latter one overclocked at 2*2.1+4*1.7. It’s even faster than my i7-6700k at 4.4 GHz thanks to the CRC instructions.
And there, given the performance impact of the RAM settings, I think the algo is reasonably dependent on memory speed, it’s just that other factors can count for a big part as well. We often tend to see various limitations as real limits while they are not, they should be seen as uncompressible time added into a loop : when the rest of the loop is short, it has a huge impact but when the rest of the loop is long then the impact is reduced. This typically is the case for DDR3 vs DDR4 when you’re spending time on slow CPU operations for example.
You’re actions reflect those of someone whose goal is not to provide unbiased feedback, but sell something.
Performance / $ would put Pi on top. You completely neglect software. You’ve ignored every constructive suggestion others have clearly made and claimed the responders are being “mean”.
Fortunately in the U.S. there are laws that fine advertising without disclosure. So if anyone in the U.S. buys such a product based on your “analysis” and finds it incorrect- you are liable for false advertising and damages.
Take off the tinfoil hat. He isn’t selling anything. Quite the opposite actually. I know others have questioned the benchmarking used, but I can tell you for a fact that out of all of those SBCs, there is no way in hell the Pi gives the best performance per dollar.
>I can tell you for a fact that out of all of those SBCs, there is no way in hell the Pi gives the best performance per dollar.
I think that almost everyone on this site (except Jerry) will agree on this 🙂
Musta hit the nail on the head. Triggered a reaction and the obvious deflection is to call someone crazy.
Pi Zero is $5. Pi Zero W is $10. Performance/$ is basic math, if division is too difficult, enjoy your internet circle jerk lol
> Regarding /tmp… you’re being alarmist, but you’re right in this: It would indeed be better practice to move this operation away from a user-accessible folder.
Check manual page of mktemp, chmod, do a web search for ‘temp file vulnerability’ and spend a few hours on the issue please 🙂
Honestly man, learn some humility, there is no need to be a jerk 24/7.
Some, hopefully helpful, criticism. First, decide what it is you want to convery or measure in your benchmark. Usually for an app to have a benchmark, the intent is to measure the performance of some critical piece of the app itself. For example, if your app does some large matrix math with BLAS, then that’s going to be a good indicator of performance of your app.
So, the process really starts with understanding the needs of your app. Do you spend a lot of time processing data? If so, how much data? Does it fit in the L1 or L2 caches? Do you spill to main memory? Are your memory reads sequential or mostly random? Are your data access patters latency sensitive (do you follow lists of pointers a lot)?
What about storage? Do you do much I/O or does your app live in RAM? If it lives in RAM, how much memory does it take per ? How many of those things can you handle before you use up 512MB, 1GB, 2GB, etc.? If it relies on storage, what are your access patterns like? Are they mostly reads? Are they sequential reads or random? Same goes for writes. Does the I/O happen all at once or is it a little bit here and there? How latency sensitive is it? (Do you chase pointers?)
Similarly for networking, how much I/O do you do? Are they big requests? Do you need to keep a connection of some sort open to each or do you create/teardown the connections as things go? Maybe you use some connectionless protocol and just listen on a port. Is there crypto involved? How complex is it? Does it make use of native crypto functionality (various ARM chips can have AES or SHA acceleration instructions that can have a huge impact on crypto speed)? Is the protocol latency sensitive? Do you transfer lots of data?
There’s a lot more to it that that, but that should get you started. Once you’ve characterized your app, start to look for ways to test each of these limits that might effect your application performance. This can often involve some testing–test the app with different amounts of memory, ethernet speeds, slow and fast storage, different processor clocks, etc. See how it scales with those artificial limits. That will give you a good idea what you need to put into an application benchmark–that will be useful as it can have predictive ability of real application performance.
Optionally, and this is a completely different way to approach the problem, but measure how much comms your app does, monitor memory, CPU useage, storage access, etc. There are common Unix ways of doing all of that. Use that data to see how well your app is performing in acutal use. You might find useful info in there or not, but it can be easier than the other methods.
Good luck. I’m sure many here would be glad to help you as you progress with this effort.
Thank you so much. Having taken the criticism constructively, v2 was released this past weekend. It addresses all of the concerns, and adds some new calculations to further improve the usefulness of GiggleScore.com
I haven’t tested it, but there’s already the Phoronix test suite, which it should be compatible with ARM as it builds from source.
https://phoronix-test-suite.com/
I checked this site out the other day when I saw it linked on the odroid forum. Obviously the testing method leaves a little to be desired (my complaint is that the testing method isn’t documented) but this is a really cool idea. It reminds me of the Backblaze drive stats that they publish.
For everyone complaining, is there an alternative to this that exists? I have searched high and low for a way to compare SBCs and have found nothing. This is the first site I have seen that even attempts to tackle this issue.
It really is not easy. Most workloads depend on a factor of integer, floating point, cache size and latency, memory, context switching speed, architectural choices and extensions, storage bandwidth, storage latency, network bandwidth, network latency, etc. And any application will have a different set of factors. One reasonable possibility consists in using a small set of tools each depending on a small set of factors (possibly with a bit of overlap) and synthesize these results in 3-4 integers, and let users know that depending on their use case, they’d rather focus on this or that column.
Then it is possible to apply a few pre-made factors and give a score for various workloads (graphics, number crunching, floating point, database, web server, network router, NAS, etc) knowing that each of these ones will systematically be attacked by users who observe that their workload is faster on board X than board Y despite the scores indicating the opposite.
The single number definitely does not work out of a well defined workload context.
For example when working on my build farms I created a metric which I called “bogolocs” (bogus “lines of code per second”), which indicates the performance to be expected from a board just based on some RAM performance measurements because I noticed a strong correlation between the two. I have not updated it for a while but I’m pretty sure that if tested on some big.little SoCs it would be bogus because it would need to take other factors into account.
Using a collection of existing tools thus definitely is a good start. If there are multiple metrics, users are forced to think multi-dimensional and start to imagine “what if”. If there is a single metric, they blindly trust it.
Hi everyone,
As the community here so kindly pointed out (hehe), the first iteration of my algorithms were less than accurate. In its defense, I would like to point out that GiggleScore.com was an idea that came to me just last month, so what was criticized here was the earliest iteration of a rushed hobby project.
I appreciate all the excellent information that was shared in this thread, and chose to take it all constructively. This past weekend, I launched v2, which implements the changes brought about by the comments I received here. And you will find the Raspberry Pi ranks very highly, and the ODROID-XU4 now carries a fair result.
GiggleScore.com will continually evolve, but I feel it is now quite useful, providing several key pieces of information about a number of single board computers in our test pool.
Take a peek at the new version, and if you have any suggestions or requests, I’m all ears.
Thanks, everyone. I hope you enjoy using GiggleScore.com
Robbie // The Bald Nerd
> I launched v2, which implements the changes brought about by the comments I received here
I don’t think so for various reasons:
1) it’s impossible to generate a performance chart relying on a single metric/tool. The use cases those SBC are used for are too different and the architecture differences (especially with big.LITTLE/DynamIQ designs) make it impossible to use one score to rank different SoCs or boards. The importance of single vs multi threaded for various use cases alone prevents the use of a single score
2) your math is flawed. You can not add the single-threaded 7-zip score from first and last CPU core and divide by two. This way you ruin both single-threaded as well as multi-threaded scores and simply generate another kind of ‘numbers without meaning’.
I tried to explain both in more detail at your repo: https://github.com/Cat5TV/nems-scripts/issues/2#issuecomment-490517169
> And you will find the Raspberry Pi ranks very highly, and the ODROID-XU4 now carries a fair result
Sorry, but that’s not the purpose of generating some funny numbers to rank SBCs. The benchmark used should relate to real-world scenarios of importance for the user or use case in question. Unfortunately the whole approach is broken by design and can’t be fixed by choosing another tool and another ‘algorithm’ to massage numbers for some ranking.