
Hello, the device I am going to review is the MaUWB_DW3000 with STM32 AT Command. This is an Ultra-wideband (UWB) module from MakerFabs. The core UWB module on this board is the DW3000 UWB transceiver, and it is also equipped with an ESP32 microcontroller programmable with the Arduino IDE, as well as OLED display. The manufacturer claims that this UWB board resolves multiple anchors and tags mutual conflicts and supports up to 8 anchors and 64 tags. Additionally, the manufacturer has added an STM32 microcontroller to handle UWB multiplexing, allowing users to control the core UWB module by simply sending AT commands from an ESP32 microcontroller to the STM32 microcontroller. More information about this UWB board can be found on the manufacturer’s website.
“MaUWB_DW3000 with STM32 AT Command” unboxing
MakerFabs sent the package to me from China. Inside the package, there were 4 sets of the MaUWB_DW3000 with STM32 AT Command. Each set contains the module, a 3.7V 600mAh battery, and 2 pieces of 2.54mm 12-pin male pin headers. Additionally, there were 4 extra batteries and an ST-LINK V2 for uploading firmware to the STM32 microcontroller.


The main PCB has a red solder mask. On the top side, the primary components include the ESP32-WROVER-B module and a 128×64 OLED display. Near the USB Type-C connector, there are RST and FLASH buttons. An external battery can be connected to this board using a JST connector. There are twelve 2.54mm holes for soldering straight male header pins along the side of the board. On each corner, there is an M3 hole for installing support column spacers. The MaUWB-DW3000 module is soldered on the bottom side of the board with the silkscreened text “ESP32 AT UWB Pro with Display v1.1”
First time testing
I started my test by connecting the module to a computer using a USB Type-C cable, and I found that the device started instantly. The green LD9 LED on the top side of the PCB remained solid, indicating that the device was powered through the USB port. Next, I tested powering the device using the provided 3.7V 600mAh battery. During charging, the LD8 LED (red) remained solid, and it turned off after the charging was completed. The power LED, labeled as PWR LED, is installed on the bottom side of the board. Additionally, there are red and blue LEDs that blink when there is communication with the UWB module.

I then opened a Serial monitor to observe the data output by the default firmware. During the startup, the device reported the hardware and software firmware versions, along with the configuration parameters such as the device ID and the refresh rate. As shown in the following result, this module was configured as a tag where its ID was set to ‘0’. The AT+SETCAP command set the refresh rate to 15Hz.
|
1 2 3 4 5 6 7 8 9 10 11 12 13 14 15 16 17 18 19 20 21 22 23 24 25 26 27 28 29 30 31 32 33 |
12:57:35.327 -> Hello! ESP32-S3 AT command V1.0 TestAT? 12:57:40.332 -> OK 12:57:40.332 -> 12:57:40.332 -> AT+RESTORE 12:57:45.393 -> OK 12:57:45.393 -> Master/Slaver flash normal 12:57:45.393 -> ReadCheck MasterCheck��51F44581 SlaverCheck51F44581 12:57:45.393 -> *******************System Parameter******************* 12:57:45.393 -> UWB Module Compile:15:25:17 Feb 23 2024 12:57:45.393 -> UWB Module Software:v01_00_008 12:57:45.393 -> UWB Module Hardware:v01_03_000 12:57:45.393 -> UWB Module Flag:AAAA 12:57:45.393 -> UWB Module BootT:1 12:57:45.393 -> UWB Module Error_Bit1:0, Error_Bit2:0, Error_Bit3:0, Error_Bit4:0, Error_Bit5:0 12:57:45.393 -> UWB Module Role:None, Id:-1, Rate:6.8M, Filter:1, AntTx:16336, AutoRpt:1, PA:1 12:57:45.393 -> ****************************************************** 12:57:45.393 -> 12:57:45.393 -> portGetTickCnt:1418, scale:0.850, rtcCount1706 12:57:45.393 -> 12:57:45.393 -> AT+SETCFG=0,0,0,1 12:57:47.370 -> OK 12:57:47.370 -> 12:57:47.370 -> AT+SETCAP=10,15 12:57:49.393 -> OK 12:57:49.393 -> 12:57:49.393 -> AT+SETRPT=1 12:57:51.380 -> OK 12:57:51.380 -> 12:57:51.380 -> AT+SAVE 12:57:53.391 -> OK 12:57:53.391 -> 12:57:53.391 -> AT+RESTART 12:57:55.427 -> OK |
Controlling the UWB module using AT Commands
We can control the UWB module by sending AT commands to the module through a serial port. According to the AT Command Manual version 1.0.7, the module currently supports 15 commands, which can be categorized as follows:
- Serial port test
- Get module version
- Restart the module
- Get/set configuration
- Get/set basic module parameters
- Get/set module antenna delay
- Get/set capacity/refresh rate
- Enable/disable distance data report
- Set the tag device the sleep time
One of the commands I frequently used was AT+SETCFG, which configures the device’s role as either an anchor or a tag. The syntax of the command is AT+SETCFG=x1,x2,x3,x4, where:
x1: device ID (anchor: 0 – 7, tag: 0- 63),x2: device role (tag: 0, anchor: 1),x3: communication rate (850K: 0, 6.8M: 1), andx4: range filtering (disabled: 0, enable: 1)
Preparing the Arduino Environment
The instructions for installing the required Arduino libraries and examples for the UWB board are available on the Wiki and GitHub and they are easy to follow. Although the suggested Arduino IDE versions are 1.8.10/1.8.19, I encountered no issues using version 2.2.1. I set up my programming environment by cloning the source codes from GitHub and used the ESP32 board version 2.0.3, which was already installed on my computer. Additionally, I changed the default Sketchbook Location of the Arduino IDE to another location to determine which additional libraries would be needed. I found that I only needed to install the latest version of the Adafruit SSD1306 Library and its dependencies, which include the Adafruit GFX Library and Adafruit BusIO. No other extra libraries were required. Finally, I selected the target board as ESP32 Dev Module, as suggested on the website.

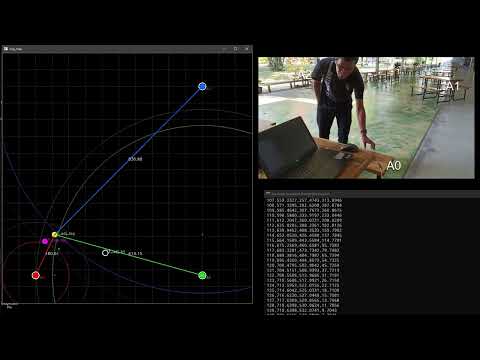
Arduino UWB Test 1: One Tag + One Anchor test
I began programming the module in the one tag + one anchor mode. This mode requires one device to run as an anchor and another device to run as a tag. For the tag module, I simply opened the examples/esp32_at_t0/esp32_at_t0.ino Arduino source file. Without making any modifications, I selected the target COM port and pressed the Upload button, and the tag module ran without any problems. Similarly, for the anchor module, I used the source file from examples/esp32_at_a0/esp32_at_a0.ino and uploaded it to the target device without any issues. The default parameters set the ID of the anchor module to A0 and the ID of the tag module to T0.
After opening the Serial monitor, I observed that both devices output the same message, as shown in the following figure. The tag T0 was on the left, and the anchor A0 was on the right. These messages were the output of the AT+RANGE command. In each line, the tid parameter indicates the ID of the tag, while the range represents the distances (in centimeters) from the tag to the nearby anchors. The rssi parameter indicates the signal strength values (in dBm) from the tag to the anchors. These values are stored as a list, ordered by the anchor’s ID. We can enable and disable these reports by sending AT+SETRPT=1 and AT+SETRPT=0, respectively.

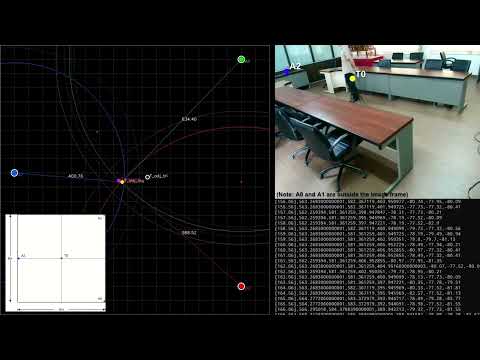
Arduino UWB Test 2: Multi Tag + Multi Anchor test
Working in the one anchor + one tag mode provides us with distances and signal strengths between a tag node and surrounding anchors. However, we are not limited to using just one tag. We can add more tags and anchors by modifying the example codes mentioned above so that all devices have unique IDs. To set the ID for an anchor, we can modify the esp32_at_a0.ino in line 57. The original code, sendData(“AT+SETCFG=0,1,0,1”, 2000, 1);, sends the AT command to configure the device as an anchor with ID = 0. To change the ID to 1, I simply replaced the first 0 in the command with 1, resulting in sendData(“AT+SETCFG=1,1,0,1”, 2000, 1);. For the tag, I configured the tag ID by changing the UWB_INDEX in the esp32_at_t0.ino source file from 0 to 1 as shown below.

If we have three or more anchors, we can calculate the position of the tag using the reported distances from the tag to each of the anchors. To do this, you can follow the UWB positioning development with Python example in the WiKi. Briefly, you will need one tag and four anchors. You may need to use the get_range.ino Arduino sketch to configure A0 UWB anchor to collect the distances, format, and output the data through the Serial port. Please note that during this review, the link to the get_range.ino in the WiKi points to the wrong file. Then, the position.exe or position.py will read the distances and calculate the 2D position of the tag. I checked the Python script and found that the following three_point function is the core of the calculation. This function receives the positions of two anchors and distances to the anchors as its parameters and returns the estimated position of the tag relative to those two anchors. So, by using all pairs of anchors, the final position of the tag is obtained by averaging all of the estimated positions. More details about the position testing will be explained in the later section.
|
1 2 3 4 5 6 7 8 9 10 11 12 13 14 15 16 |
def three_point(self, x1, y1, x2, y2, r1, r2): temp_x = 0.0 temp_y = 0.0 p2p = (x1 - x2)*(x1 - x2) + (y1 - y2)*(y1 - y2) p2p = math.sqrt(p2p) if r1 + r2 <= p2p: temp_x = x1 + (x2 - x1) * r1 / (r1 + r2) temp_y = y1 + (y2 - y1) * r1 / (r1 + r2) else: dr = p2p / 2 + (r1 * r1 - r2 * r2) / (2 * p2p) temp_x = x1 + (x2 - x1) * dr / p2p temp_y = y1 + (y2 - y1) * dr / p2p return temp_x, temp_y |
UWB Range test
Indoor test
I conducted indoor-ranging tests on the ground floor of the Faculty of Computer Science and Information Technology (CSIT), Rambhai Barni Rajabhat University, as shown in the following figure. Each block has dimensions of 4x8m, with some rooms possibly extending one or two blocks. The texts above each room indicate the name of the room. The walls, approximately 10cm thick, are represented by solid black lines, while the dashed blue lines represent thinner walls made of aluminum frames and clear glass. In this test, I placed the anchor A0 at the lower right corner of the Meeting room, marked as a red dot. Then, I moved the tag T0 to various positions as illustrated by the yellow dots. The blue and red labels near the yellow dots represent the reported distance in cm and signal strength in dBm, respectively. The total distance from A0 to the farthest wall (the left wall of the ST Room) is approximately 44m.

Inside the Meeting room where A0 is placed, I could easily receive the reported values regardless of the orientation of the tag. Moving to the G1 and G2 rooms, I still received the signal without any difficulty. However, upon entering the D1 room, although I could still catch the signal from A0, the signal strength dropped to around -90dBm. I had to carefully adjust the orientation of the tag to maintain communication with A0. The farthest positions where I was able to receive measurement data were around 20m from A0, as indicated by the two dots in the CSIT Office-1 room. Here, the RSSI dropped as low as -121.70 dBm, with occasional fluctuations to -90.52 dBm.
The farthest positions where I was able to receive measurement data were around 20m from A0, as indicated by the two dots on the right wall of the CSIT Office-1 room. In this case, it was extremely difficult to catch the signal from the anchor, and the orientation of the tag had to be adjusted very carefully. The only RSSI value reported here was -121.70 dBm. It was not possible to get the reported distance at the other corners of this room or at other positions, no matter what I tried.
Outdoor test
The following figure illustrates the outdoor testing in front of the CSIT building. The anchor A0 was positioned at marker A at the rightmost end of the yellow line. Markers P0 to P4 represent the positions where I checked the signal strengths. At P0, or nearby positions where the distance to A0 was around 20m, the signal strength was approximately -81.93 dBm. I could easily receive the reported values and did not have to pay much attention to adjusting the orientation of the tag. However, as I moved closer to P1, or somewhere between 30 – 50m from the anchor, communication became more difficult, and I had to adjust the orientation of the tag carefully. The RSSI dropped to around -87.92 dBm to -90.52 dBm. Moving further to P2 and P3, which were around 80m from A0, communication between the two devices became extremely difficult, and the device rarely updated the data. The RSSI reported here was as low as -121.70 dBm. Beyond P4, I could not receive any reports from the device.

I also conducted another outdoor test on Sukhumvit Road in front of the university, where the topography of the area is rolling plains. The yellow line represents the total distance I initially decided to make the measurements. I placed the anchor A0 at position A and obtained similar results to the previous outdoor test. At position P0, which was approximately 50m from the anchor, the devices were able to communicate, but it was quite difficult. The farthest position from which I could receive values was at P1, which was around 100m from the anchor.

Please note that all of the range tests conducted above were performed in an uncontrolled environment and using default configurations. The performance of the ranging should be carefully tested in both controlled and uncontrolled environments. Also, all configurations that may affect communication ranges must be considered.
Reducing range error

I noticed significant variations in the reported distances from T0 to each of the anchors, despite placing them very close together. The figure below illustrates the offsets of the measurements from each of the anchors. The red, green, and blue lines represent the data from anchors A0, A1, and A2, respectively. I positioned the three anchors on a tripod as closely as possible and then moved T0 away from the anchors. I consistently found discrepancies between the reported distances and the actual values. For example, when the tag was positioned 200cm from the anchor, the reported distance might be 240cm. Despite the anchors being separated by no more than 5cm, some of the reported distances differed by 10–30cm from each other.
Since these errors impact the accuracy of the estimated position of the tag, I conducted a test to examine the relationship between the reported values and the actual values. In this test, I placed the tag T0 at 11 different distances from anchor A0, with the testing distances being {50, 100, 200, 300, 400, 500, 1000, 1500, 2000, 2500, and 3000} cm. It’s important to note that these reference values were manually measured using a measurement tape, and the margin of error in my measurements is approximately ±10cm.
I positioned T0 at each distance and recorded the reported values for approximately 3 minutes. Then, I plotted a graph to examine the relationship between the values and discovered that the relationship appeared to be very linear. Therefore, I applied the least squares technique to determine the equations of the lines that best fit the data, as depicted in the following figure. The red, green, and blue lines represent the lines that best fit the data observed by anchors A0, A1, and A2, respectively. The magenta line represents the relationship of the actual value. The calculated coefficients (m, b) for A0, A1, and A2 were as follows.
|
1 2 3 |
m_a0, b_a0 = [1.008906,-61.244514] m_a1, b_a1 = [1.005860,-50.318821] m_a2, b_a2 = [1.000626,-53.335105] |

The following boxplots represent the distances recorded by each anchor. It can be observed that when the tag and the anchor were very close, the error in the distance measurement was higher compared to when they were 5 meters or more apart.


Positioning test
The following video depicted my real-time 2D positioning testing. The positions of A0, A1, and A2 were represented by the red, green, and blue dots respectively. The tag T0 was moved among the positions of the anchors. The hollow white circle represented the estimated position of the tag obtained using the three_point function described earlier. The solid yellow circle represented the position obtained by adjusting the raw measurement distances with the coefficients I reported above, then using these adjusted values along with the known positions of the anchors to estimate the tag position using a least squares technique. The solid magenta circle was also obtained by the least squares technique, but using the raw measurement values instead of the adjusted values. Although there was some delay in the plotting, the overall results were very satisfying. (Please note that the distance overlaid on the line connecting each pair of the anchors in this video was in pixel units, while in the following videos, the units were in centimeters).
I implemented the following function to estimate the position of the tag using the least squares method. This approach is based on a paper by Mathias Pelka, and a paper by Han and Poulose, as well as source code provided by James Remington on GitHub.
|
1 2 3 4 5 6 7 8 9 10 11 12 13 14 15 16 17 18 19 20 21 22 23 24 25 26 27 28 29 30 31 32 33 |
def cal_tag_position_leastsquares(anchor1, anchor2, anchor3, d1, d2, d3): x1 = anchor1[0] y1 = anchor1[1] x2 = anchor2[0] y2 = anchor2[1] x3 = anchor3[0] y3 = anchor3[1] A = numpy.asarray([ [2*(x2-x1), 2*(y2-y1)], [2*(x3-x1), 2*(y3-y1)], ]) # squared x1_sq = x1**2 y1_sq = y1**2 x2_sq = x2**2 y2_sq = y2**2 x3_sq = x3**2 y3_sq = y3**2 d1_sq = d1**2 d2_sq = d2**2 d3_sq = d3**2 b = numpy.asarray([ [d1_sq - d2_sq + x2_sq + y2_sq - x1_sq - y1_sq], [d1_sq - d3_sq + x3_sq + y3_sq - x1_sq - y1_sq], ]) try: p, _, _, _ = numpy.linalg.lstsq(A, b, rcond=None) except numpy.linalg.LinAlgError: p = None return p |
Accuracy assessment
Empty environment
Since I didn’t have enough time and precise instruments to make accurate measurements, I decided to test the precision of the estimated positions of the tag by comparing the offset of each reported data from their mean value. So, I positioned the anchors A0, A1, and A2 as shown by the red, green, and blue circles in the following figure. The coordinates of the anchors were manually measured using a measurement tape, with an error margin of approximately ±10cm. The positions of the hollow white circle, solid yellow circle, and solid magenta circle were calculated as previously mentioned. Then, the positions and the corresponding RSSI values were recorded for around 3 minutes. The following data shows the results of the recording. It can be clearly seen that the distance values vary very little, i.e., around 1 – 2cm.
|
1 2 3 4 5 6 7 8 9 10 11 12 13 14 15 16 17 |
D0,D1,D2,RSSI0,RSSI1,RSSI2 409,362,381,-83.77,-82.89,-79.51 408,362,382,-80.95,-82.38,-79.31 408,363,383,-80.76,-82.89,-79.31 408,362,383,-80.97,-82.11,-81.35 408,363,383,-81.32,-82.38,-81.13 407,362,382,-81.55,-82.11,-79.51 407,362,382,-79.51,-82.38,-81.35 407,363,383,-81.32,-82.52,-79.51 407,362,384,-81.13,-83.29,-79.24 407,363,383,-81.32,-82.71,-79.51 407,363,383,-81.13,-82.71,-81.35 406,363,382,-80.41,-83.29,-81.35 406,363,383,-81.13,-82.71,-81.35 406,363,383,-84.33,-82.71,-79.51 406,364,383,-80.41,-82.71,-79.51 ... |


Then, I computed the DRMS (distance root mean squared) and the 2DRMS (Twice the Distance Root Mean Square) values. The following figure represents the 2D position error from the mean value. The DRMS is depicted as a red circle while the 2DRMS is depicted as a black circle. In this case, the DRMS of the position obtained by the raw distance values, and that of the adjusted values were 1.20cm and 1.04cm, respectively. Also, the 2DRMS of the position obtained by the raw distance values, and that of the adjusted values were 2.41cm and 2.08cm, respectively. I believe this was a very precise result. However, this test was conducted on a holiday when all of the classes were closed and there was nobody within 100m, except me.
Working day test

After the previous test, I conducted another one where all of the devices were stationary. However, in this case, I moved randomly around the scene and recorded the data for around 1 and a half minutes. The DRMS of the position obtained by the raw distance values, and that of the adjusted values, were 2.65cm and 2.31cm, respectively. Also, the 2DRMS of the position obtained by the raw distance values, and that of the adjusted values, were 5.31cm and 4.62cm, respectively. This time, the 2D position error increased, as shown in the following figure.
How the object affects the measured values
The results of the previous test indicated that my movements influenced the overall position error. I also noted that when I moved my hand or body between the tag and the anchor, the reported distances varied. Therefore, I repeated the test on a workday in an 8mx8m room, positioning the devices as illustrated in the following figure. Data was recorded for approximately 2 minutes, and the overall error remained consistent at around 2cm – 3cm, similar to the tests conducted during the holiday.


During this test, I randomly walked into the scene, occasionally attempting to occlude the line of sight between certain pairs of tags and anchors. The DRMS of the position obtained from the adjusted distance values increased from 2.34cm in the previous test to around 17.25cm, approximately 7 times greater than that of the previous test
The following figures compare the position errors observed in the two tests.


Walk along the walls of the room test
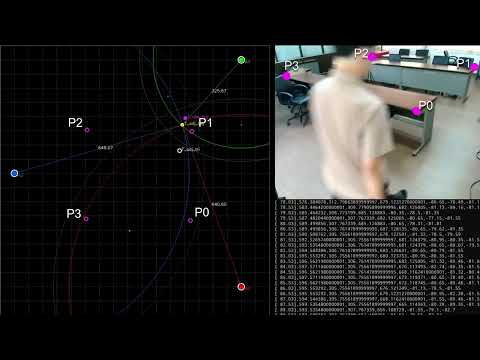
My last test for this review involved moving T0 to the corners of the tables, as illustrated by the magenta dots labeled P0 to P3 in the following video. Then, I moved T0 and walked along the walls of the room. I was very satisfied with this result, especially towards the end of the video where T0 moved along the walls and the estimated track came out as straight lines as expected.
Others
I found no major issues during this review, except for a few minor ones. For instance, I noticed that some SMD components on one of my boards were not soldered properly. Specifically, D2 and D5 LEDs, as shown in the image, were misaligned.D2 was not in its correct position and almost made contact with nearby components such as a resistor and a capacitor.

Furthermore, both the website and GitHub pages of another UWB module from the manufacturer, the ESP32 UWB (Ultra Wideband), mention that it also uses the DW3000 UWB which is interoperable with the Apple U1 chip and potentially compatible with the Apple ecosystem. However, during this review, I was unable to locate any example code to verify this interoperability.
If you’re interested, the manufacturer also provides the PCB layout and schematic diagrams on GitHub. I was able to open them using Autodesk Eagle 9.6.2, as shown in the following figures.


Conclusions
As previously mentioned, all of my tests were conducted using a generic measurement tape, and I used the default configurations as provided in the example files. However, it’s important to note that I only measured precision, which involved finding the offset from the average deviation. I did not conduct tests to measure accuracy, which would involve determining how far the reported position is from the target position. This type of testing would require more time and better instruments. Throughout this review, I was able to reduce the position error by employing the linear least squares fitting method. Alternatively, calibration of the antenna delay using specialized equipment could also be performed to achieve better results. Another approach would be to use the binary search technique to find the proper value for the antenna delay, as described by James Remington on his GitHub and in the example code of the ESP32 UWB (Ultra Wideband) module as well.
I would like to thank MakerFabs for providing me with the devices for this review. They have proven to be very useful for both my teaching and research projects. In my opinion, this UWB module is an excellent choice for developers in need of an indoor and outdoor positioning system alternative. It offers better precision compared to generic GNSS receivers as well. For those interested, the MaUWB_DW3000 with STM32 AT Command can be purchased for $54.80 on the Markerfabs store.

My main research areas are digital image/audio processing, digital photogrammetry, AI, IoT, and UAV. I am open to other subjects as well.
Support CNX Software! Donate via cryptocurrencies, become a Patron on Patreon, or purchase goods on Amazon or Aliexpress. We also use affiliate links in articles to earn commissions if you make a purchase after clicking on those links.


I’m working with these modules for the last 4months.
I agree with you, it is easy to measure distances.
But Makerfabs is doing some stuff to be aware of when fully utilizing these:
Nice boards, especially better than the ones with the DW1000, but don’t expect too much 🙂
Don’t expect too much, in terms of accuracy? Quality?
Is there no other way of communication with the radio then using old fashioned AT commands?, seems a bit inefficient, I²C or SPI would seem more logic to me.
Hello Mr. Kumpee Teeravech,
I am writing to you from Turkey. I am a master’s student. I purchased the “MaUWB_DW3000 with STM32 AT Command Review.” I used the information provided by the company. I have reviewed your work, “MaUWB_DW3000 with STM32 AT Command Review – Using Arduino to test UWB range, precision, indoor positioning.” I found the Python code you used in your work to be very successful. It has a better visual appearance than the “position.py” shared by Makerfabs. It excellently explains the use of “threelateration.” If it is not an inconvenience for you, could you share the Python code that provides the “Realtime plotting” output in your work? I am aware that this request is not very polite. However, despite my efforts, I could not write the code as well as you did. Thank you in advance for your interest.
Hi, Emrah. Please check the code at my GitHub (https://github.com/kumpee/makerfabs_mauwb_dw3000_with_stm32_at_command)