CNXSoft: This is a guest post by Renato Kiss, Product Manager – Software at Toradex, explaining how IoT device monitoring can be used with open-source software tools like Fluent Bit to improve product reliability, using temperature monitoring as an example.
It is impossible to dissociate connected devices from modern life. They are present in homes, offices, industries – basically, in every business, connected devices play vital roles.
In a market estimated at 24.1 billion devices and with a revenue of more than USD 1.5 trillion by 2030, IoT will grow based on both consumer and business applications. Hardware will account for about one-third of this value with the majority being distributed in services, including the connectivity for the system.
As part of this growth, more services will be added to IoT business and some specialists estimate the economic potential, including IoT products and services, can unlock at least USD 5.5 trillion to 12.6 trillion in value by 2030. This economic potential includes the value captured by customers and consumers of IoT products and services. Around 65% of the total value that IoT can create will be on B2B applications, led by factory and production environments. B2C is also growing fast and is led by the great adoption of IoT solutions inside the home.
Device monitoring, as a service, will be a small part of the services offered by companies. However, it will be crucial for the value customers can create by the usage of IoT devices. Device monitoring can help customers to monitor and improve processes, get security warnings, understand the resource usage of the system, check environmental data and an almost infinite number of applications deployed on the exact point customer can extract the most value of acquired data.
What is Device Monitoring?
Device monitoring, simply put, is acquiring and checking data related to the health, performance, or resources of the electronic device. In the IoT context, the device monitoring term is better coined as remote device monitoring but to simplify, in this article (and in the IoT market) the word ‘remote’ will be omitted.
Device Monitoring in the strict sense is not a new thing. Local device monitoring is part of every production line around the globe. Data has been collected in factory machines to improve the process and machine usage for decades. Maintenance staff can measure temperature, fan speed, noises, and any relevant data to compare to the previous or pre-defined range of values. So, if it is not a new business, why the hype around IoT device monitoring? The main reason is the possibility to do it remotely and more importantly, there is no need for any external equipment or person to locally monitor the equipment or product. Devices can do it in a self-manner and send all the relevant data through the internet to a data aggregator hub, where these data can be processed, displayed, and/or stored.
Devices can be grouped in fleets when deployed to the field. A fleet groups similar devices and can greatly help with device management and monitoring. Device monitoring is intrinsically connected to fleet monitoring. One refers to device-specific data and variables. Other relates to population data and statistics of devices grouped.
Some advantages of using device monitoring can be taken from this context: you do not need a person or equipment on every site to check the desired parameters. But it is only the starting point!
Advantages of Device Monitoring
Today’s connected devices are critical in the process. They are smart and sometimes take control of parts of the process or even the entire process. A failure can compromise not only the device but also the whole business chain. Monitoring an IoT device is not only fancy, it is mission-critical. Device monitoring allows detecting possible issues before it causes a distribution at the customer.
Device monitoring can already add a lot of value in the product development phase. It can provide valuable feedback while the product is still in development and in pilot runs.
Once the project is finished, with device monitoring in place, hundreds to ten thousand devices can be deployed to the field and all critical resources can be checked remotely with just a mouse click. Logs, metrics, warnings, and reports can be obtained from geographically distant sites and compared to each other to improve the quality of the product, correct software bugs, act before a crash occurs, or simply improve the database for the next product design.
It is impossible to get access to all necessary data from all devices deployed in the field or even inside a factory or business unit without an easy-to-use and reliable device monitoring system.
Adding Value to Products
There are plenty of cases where device monitoring can be the difference between a reliable and a non-reliable system.
Starting at the development phase, prototype fleets can be deployed into real conditions and monitored all the time. Every log problem can be correlated to a physical or environmental factor. For example, some kernel panic can be directly correlated with CPU usage, used memory, or even temperature or voltage. Sending correct metrics gives the user a full picture of the device’s past.
Devices in high-stress conditions can be chosen early for preventive maintenance or simply monitored more frequently and closely.
During new software updates, it is important to monitor resources after deployment, in order to check unexpected changes in the major number of devices to prevent untested or racing conditions in the field. It can be done in conjunction with software update campaigns – when the software update can be done in sequential batches. For example, starting with 10% of the fleet, and monitoring the updated devices closely. Using the real metrics and logs, all possible crashing, faults, or misbehavior of the application can be handled with more precision and a patch can be released with high confidence that the “real issue” was solved. No guessing based on simulated lab conditions.
In the product’s life, some conditions can be pre-empted or managed in order to allow the product to last and be available longer. This is especially important for equipment pertaining to 24/7-critical services. The maintenance plan should be coordinated carefully, and outages can be avoided. For such equipment, even in case of failure, device monitoring can reduce the time needed to solve the problem. With the right data and solution in your hands, it is easy to explain the reasons for failure and prepare more barriers to mitigate such failure going forward. In all cases, device monitoring will result in reduced overall cost and less stressful situations.
Some possible usage for logs and metrics:
- Detect abnormal changes in computation resources like RAM, Flash, CPU usage
- Monitor changes in usage or availability of resources to the applications or OS, like cache memory, application reserved memory, network bandwidth
- Detect unexpected delays or impaired response time of some functions or tasks
- Measure environment and sensors like voltage, power consumption, temperature
- Detect memory leaks even if it takes a long period to increase
- Check if services or application containers are not running
- Measure battery cycle and use charge and discharge rate
Monitoring data allow acting and planning:
- Fix system memory leak before it affects the system
- Understand and workaround situations of suddenly reboot or product hangs
- Replace a battery or send some ads to the customer to buy a new one
- Reduce recalls or plan a recall before a catastrophic failure
- Detect if the device is using too much bandwidth or if your internet provider is not delivering the data plan you signed up for
- Detect issues before equipment failure and preventively act to avoid a service case
- Dynamically calculate expected lifetime
- Detect if a specific device behaves differently than others of the same type
- Get statistics when a product fails. Create a product life history with real data.
How does IoT Device Monitoring work?
In order to send data from embedded devices to the internet, it is necessary to use a device running an operating system with a monitoring agent, a Web Platform to receive and show the data and the internet connection between them.
Starting from data, we can break it down into three types in embedded systems device monitoring :
- metrics: is a numerical value that we can measure and report at regular intervals over time, like memory usage, CPU temperature, or custom data from our users’ applications
- logs: are just the log output of various parts of the system products, including docker container logs, kernel logs, and application logs from journald.
- alerts: are special events or errors that the device wants to raise in real-time because they require attention or remediation, like when a critical application fails to launch, or the device is running out of storage space
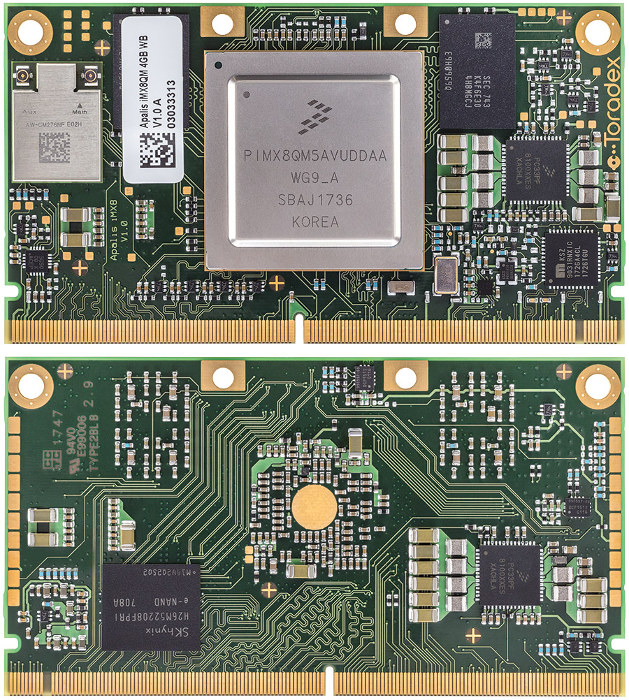
For this article, i.MX Based Toradex Computer on Modules (also known as System on Module) will be used running TorizonCore.
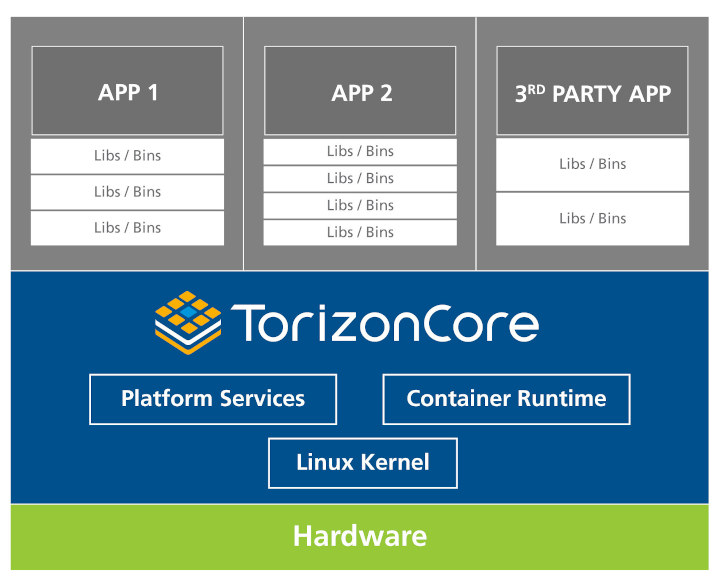
TorizonCore is an open-sourceIndustrial Embedded Linux Distribution meant to be easy to use. It comes with a Remote Over The Air (OTA) Update Client with Automotive grade security and a device monitoring agent. Out of the box, TorizonCore will report some basic system info, but you can also create and send your own custom metrics to build dashboards showing whatever data is most important to you.
TorizonCore uses a monitoring agent that can collect all three types of data: metrics, logs, and alerts, and send it either to the Torizon Platform Services or independently to other external services, like AWS, Microsoft Azure, and GCP (check its online documentation to learn how). The chosen monitoring agent was Fluent Bit.
Fluent Bit is an open-source log processor and forwarder, which allows the device to collect any data, like metrics and logs, from different sources (hardware and software), enrich them with filters, and send them to multiple destinations. Fluent Bit is a lightweight Fluentd implementation in C, focused on embedded devices.
Fluent Bit can be used for log acquisition, processing, and forwarding. Data is processed in a pipeline, using 3 plugin types:
- inputs: plugins to gather and parse information from various sources.
- filters: plugins that allow modifying the data before its delivery to the destination.
- outputs: plugins that allow defining a destination for the data.
In TorizonCore, Fluent Bit data is sent via a Device data proxy. Focused on Device Security and data confidentiality, the device data proxy is a feature available in the Aktualizr-Torizon update client to send small chunks of device information to Torizon Platform Services.
The proxy opens a local TCP port and waits for JSON formatted data on it. The proxy runs on a separated thread, and only connections from localhost are accepted. Received data will be sent to Torizon Platform Services via libaktualizr’s SendDeviceData() API.
More importantly, monitoring comes ready-to-play in the TorizonCore since version 5.4.0.
Torizon Platform Services is a secure platform that enables remote services to devices. The platform offers a set of features to maintain and manage IoT Fleets. From OTA and off-line updates to Fleet and Device monitoring, Torizon Platform is a constantly improved system and offers a Web Interface to support most of the customers’ needs.
Configuring and Monitoring Devices
The first step is to get a capable SoM and a Carrier board. In this case, we’ve used an Apalis iMX6 SoM and an Ixora Carrier board.
In sequence, we’ll be using the pre-installed Toradex Easy Installer, and flash TorizonCore’s latest Image. The easiest way is to follow the Quickstart Guide.
With TorizonCore installed, you can log in on the board using a serial terminal or ssh, and develop and configure Fluent Bit. It is integrated and enabled in TorizonCore 5.4.0 or later versions.
|
1 2 3 4 5 6 7 8 9 10 11 12 13 14 15 16 17 18 19 20 |
# systemctl status fluent-bit * fluent-bit.service - Fluent Bit Loaded: loaded (/usr/lib/systemd/system/fluent-bit.service; enabled; vendor preset: enabled) Active: active (running) since Sat 2022-01-29 18:39:03 UTC; 1h 54min ago Main PID: 636 (fluent-bit) Tasks: 3 (limit: 4660) Memory: 4.4M CGroup: /system.slice/fluent-bit.service `-636 /usr/bin/fluent-bit -c /etc/fluent-bit/fluent-bit.conf Jan 29 18:39:03 apalis-imx6-10618613 fluent-bit[636]: * Copyright (C) 2019-2021 The Fluent Bit Authors Jan 29 18:39:03 apalis-imx6-10618613 fluent-bit[636]: * Copyright (C) 2015-2018 Treasure Data Jan 29 18:39:03 apalis-imx6-10618613 fluent-bit[636]: * Fluent Bit is a CNCF sub-project under the umbrella of Fluentd Jan 29 18:39:03 apalis-imx6-10618613 fluent-bit[636]: * https://fluentbit.io Jan 29 18:39:03 apalis-imx6-10618613 fluent-bit[636]: [2022/01/29 18:39:03] [ info] [engine] started (pid=636) Jan 29 18:39:03 apalis-imx6-10618613 fluent-bit[636]: [2022/01/29 18:39:03] [ info] [storage] version=1.1.1, initializing... Jan 29 18:39:03 apalis-imx6-10618613 fluent-bit[636]: [2022/01/29 18:39:03] [ info] [storage] in-memory Jan 29 18:39:03 apalis-imx6-10618613 fluent-bit[636]: [2022/01/29 18:39:03] [ info] [storage] normal synchronization mode, checksum disabled, max_chunks_up=128 Jan 29 18:39:03 apalis-imx6-10618613 fluent-bit[636]: [2022/01/29 18:39:03] [ info] [cmetrics] version=0.1.6 Jan 29 18:39:03 apalis-imx6-10618613 fluent-bit[636]: [2022/01/29 18:39:03] [ info] [sp] stream processor started |
By default, Fluent Bit is configured to monitor CPU, memory, temperature, and the docker daemon, and send the information to the Torizon Platform.
The below config file (/etc/fluent-bit/fluent-bit.conf) is used for Fluent Bit to send CPU, memory, temperature, and the Docker daemon status to Torizon Platform via proxy every 5 minutes (300 seconds). You can change this configuration by redefining the interval_sec parametes.
|
1 2 3 4 5 6 7 8 9 10 11 12 13 14 15 16 17 18 19 20 21 22 23 24 25 26 27 28 29 30 31 32 33 34 35 36 37 38 39 40 41 42 43 44 45 46 47 48 49 50 51 52 53 54 55 56 57 58 59 60 61 62 63 64 |
[SERVICE] flush 1 daemon Off log_level info parsers_file parsers.conf plugins_file plugins.conf [INPUT] name cpu tag cpu interval_sec 300 [FILTER] Name nest Match cpu Operation nest Wildcard * Nest_under cpu [INPUT] name mem tag memory interval_sec 300 [FILTER] Name nest Match memory Operation nest Wildcard * Nest_under memory [INPUT] name thermal tag temperature name_regex thermal_zone0 interval_sec 300 [FILTER] Name nest Match temperature Operation nest Wildcard * Nest_under temperature [INPUT] name proc proc_name dockerd tag proc_docker fd false mem false interval_sec 300 [FILTER] Name nest Match proc_docker Operation nest Wildcard * Nest_under docker [OUTPUT] name tcp port 8850 format json_lines match * |
With Fluent Bit you are allowed to send custom metrics. It is done using a different approach. We add the new custom field to the input section of /etc/fluent-bit/fluent-bit.conf as the example:
|
1 2 3 4 5 6 |
{ "custom": { "my_metric_1": 123.4, "my_metric_2": 567.8 } } |
And use an input plugin that accepts raw JSON as an input, like the HTTP input plugin, and nest it under the custom key with the Nest filter plugin and add the following to /etc/fluent-bit/fluent-bit.conf
|
1 2 3 4 5 6 7 8 9 10 11 |
[INPUT] name http host localhost port 9999 [FILTER] Name nest Match custom Operation nest Wildcard * Nest_under custom |
In Torizon Platform Services, you have to do the provisioning of your device. More info can be found on the Provision New Device of Developer’s Webpage.
Very soon devices can be pre-provisioned at flashing time during product tests or assembly lines. So it is easier to connect them as soon as they arrive at the end location. There is no necessity to have someone do the provisioning manually. That is important to deploy final products or deliver them to the end customer.
Temperature Monitoring Example
To illustrate one real use, a simulation environment was created to see how a device can behave and how the device measurement can help to track and detect potential problems.
Temperature is critical for any electronic system. It can negatively impact the system and lead to some obvious, easily perceived, and detectable issues, like system reboots or thermal shutdowns. However, a lot of other issues can be caused by excessive temperature, in both chronic and acute forms.
- Reduce product lifetime
- Reduce MTBF
- Increase noise of moving parts
- Decrease hardness of some plastics or other components
- Increase or reduce mechanical gaps (bending or creating voids, impairing the overall appearance and quality)
- Loss of warranty
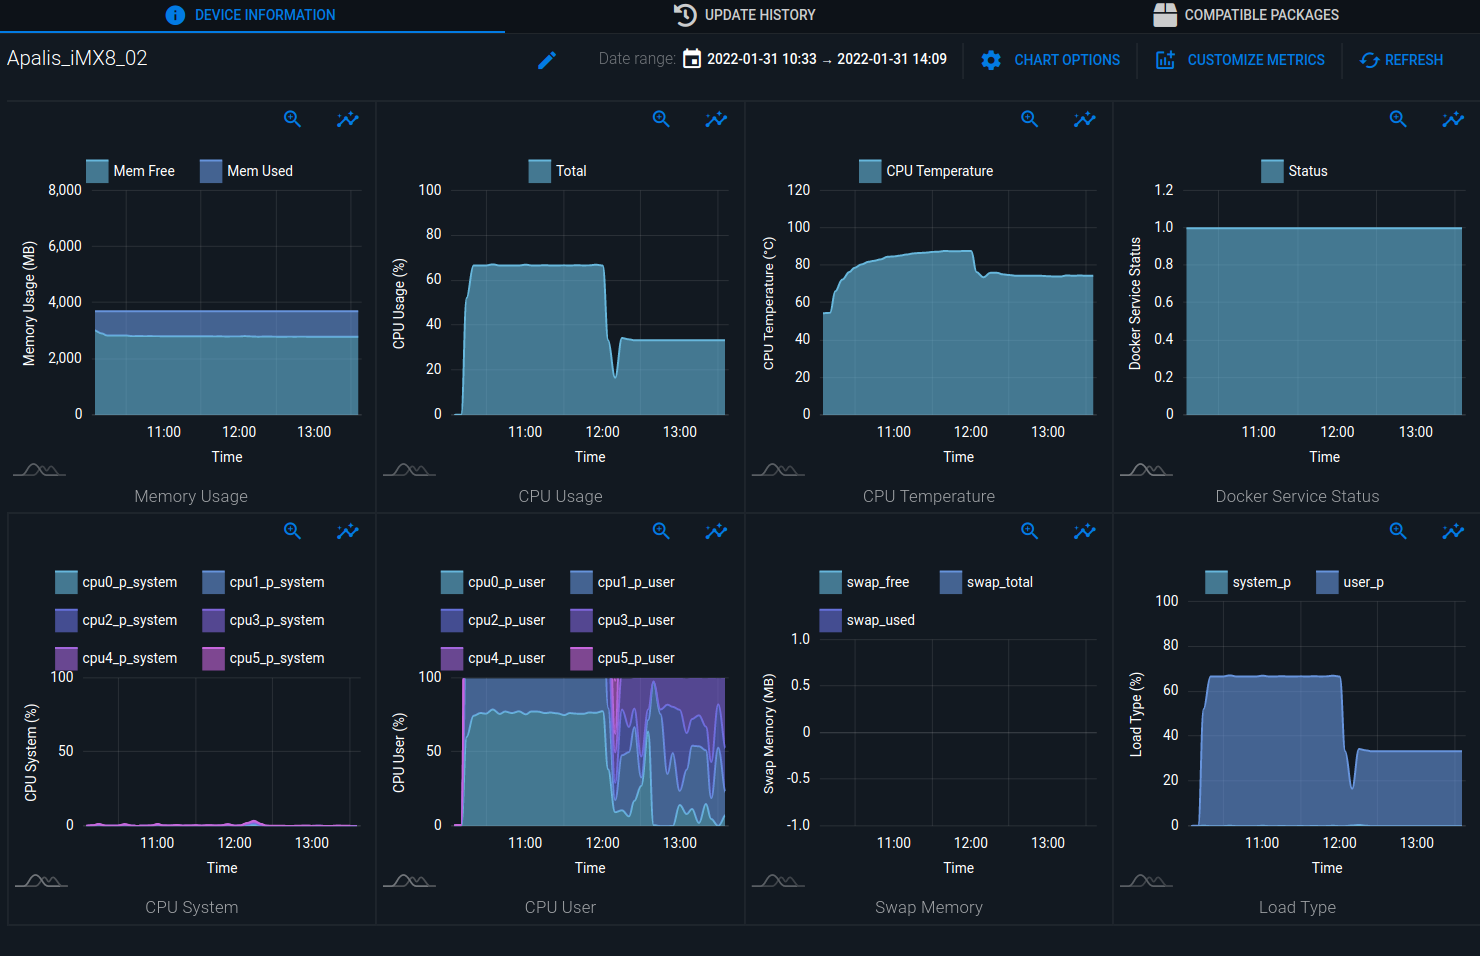
With a simple CPU measurement, we can discover some issues and act on time to prevent future drawbacks caused by temperature in excess. This measure is present in the Torizon Platform by default and there is no extra cost as it uses the i.MX internal temperature sensor.
In the following graphics, we present the device monitoring data with the CPU Temperature being measured in different environments. One board was running Torizon in a non-climatized room. The other board was in the same room but in an enclosure. Outside temperatures range from around 20°C to close to 31°C.
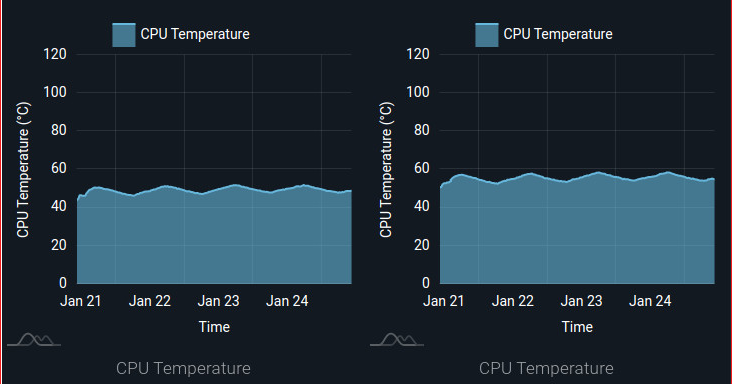
This simple example reflects the temperature fluctuation along the day as you can see in the charts. In a controlled temperature room, variations can show if your climatization system is not stable or not well dimensioned. In a non-climatized room, it will show the variation in the board boundaries.
Board 1 simulates product usage in normal conditions and with almost no CPU load. All ventilation holes are open and the board is performing as designed. Board 2 is under the same temperature conditions as the first board, but due to all ventilation holes being closed, this board shows a CPU temperature around 10°C higher than expected. These two boards can represent any board in a fleet. Board 2 can be a product that was wrongly installed or in the wrong place. It can also simulate a product with ventilation holes blocked by an external object like a book or furniture. Board 2 can also portray a product in a dirt environment with holes covered by dust – in this case, the increase in temperature will be constant and it will reach the same maximum. Board 2 can also represent a chassis fan failure or any other external issue that can cause a temperature increase in the product.
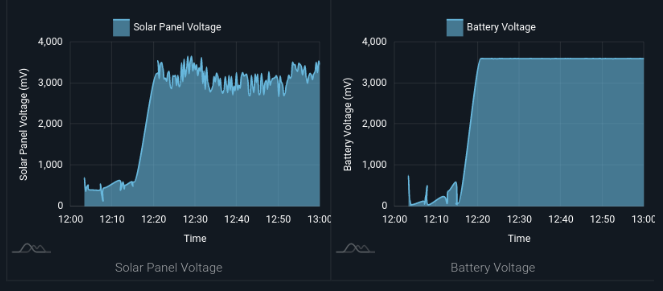
If Board 2 needs to use full CPU performance, a huge increase in temperature occurs. It can affect the product life depending on the qualification of the product. Products working closer to Si Junction Temperature will last less than others running in a more mild temperature range.
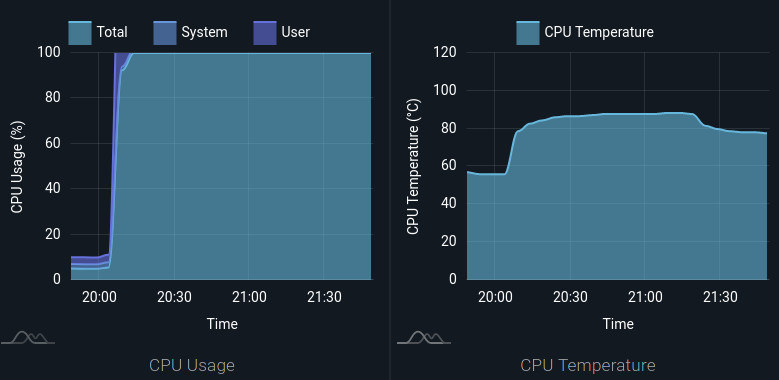
In this example, as shown in the above metrics graph, CPUs started with little load and then changed to work at full power. The temperature increased as expected, but without ventilation holes open to exchange heat, the temperature continues to slowly increase. At approximately 21:20 the enclosure was removed and the temperature starts to drop. The room temperature was about 23°C.
The i.MX specification shows it can support this range of temperature in some qualification grades. Remember that all components in the board are affected, so it is important to use qualified boards.
In a real product, with more complex analysis, the OS will act to try to reduce the power, but not without impacts to the system. For example, DVFS can control voltage and frequency, reducing them and decreasing the power and heat. However, the CPU will become slower and the tasks will take longer to conclude, so this impact should be considered in the application.
In a product in development, these metrics can lead in some cases to add a heatsink to the microprocessor, add more enclosure holes, a chassis fan or even upgrade the qualification of the used board.
For a regular product, it can drive preventive maintenance to clean up dust, move the blocking object or the product to a better place.
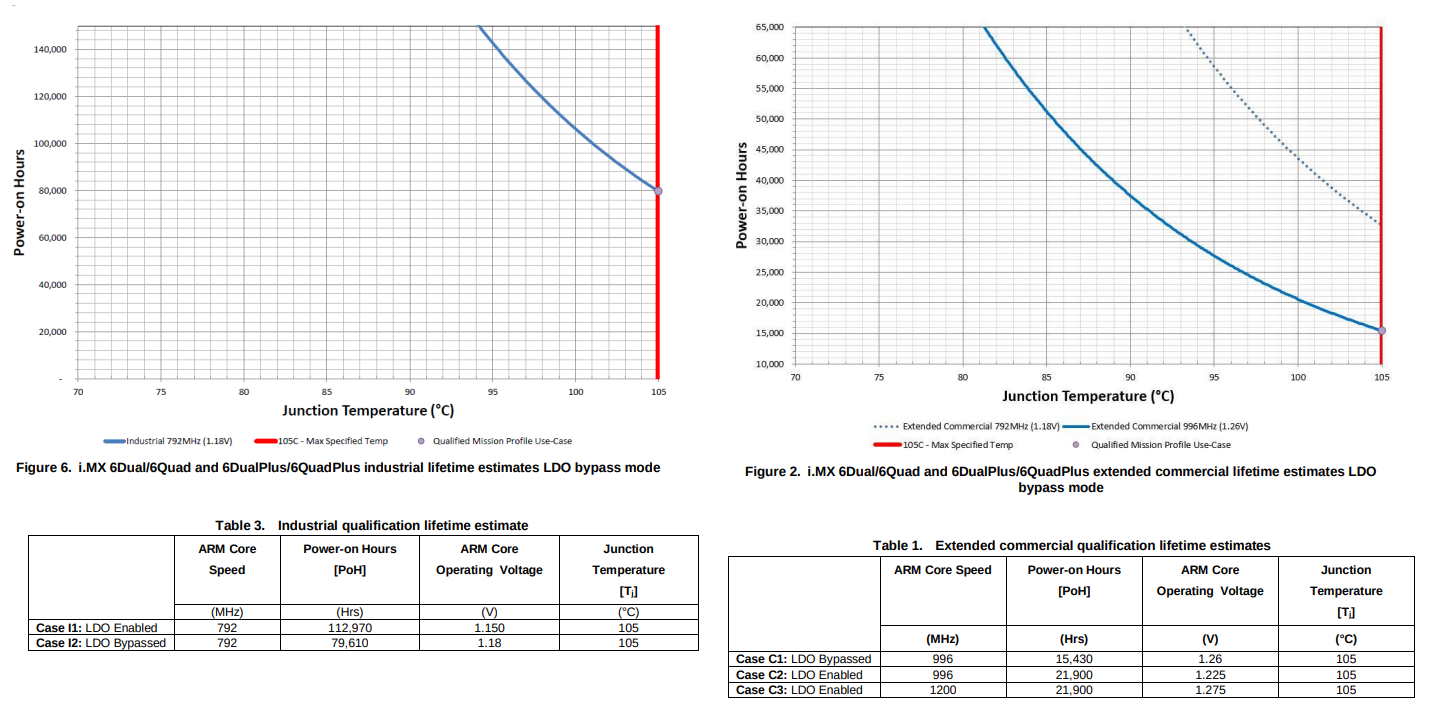
With the correct qualified part, voltage, frequency, and temperature of operation, you can use the above graphs to determine the number of power-on hours of your product. Depending on which grade your product uses, you may have life expectations affected. Device monitoring, in this case, can not only help you avoid the lifetime reduction but make you understand the reasons.
Conclusion
With the growing complexity of IoT and connected embedded devices, we have to appeal to new tools and strategies to maximize our product quality and the valor products can deliver to the market.
Device monitoring, in keeping with this trend, is one of the key services to guarantee access to the best and most accurate data and to identify and face daily issues of your project. No matter if it is during the product’s development phase or during the lifetime of the product.
If well used, device monitoring can increase reliability and greatly reduce maintenance costs and reaction time. It helps to deliver the full capability of the product for longer periods.
In the end, proper usage of device monitoring in the product allows us to attain always desired assets for our projects and products: continuous improvement, making the development process more innovative, better time to market, great customer satisfaction and as we learned from the Covid pandemic, reduced unnecessary travel.

Jean-Luc started CNX Software in 2010 as a part-time endeavor, before quitting his job as a software engineering manager, and starting to write daily news, and reviews full time later in 2011.
Support CNX Software! Donate via cryptocurrencies, become a Patron on Patreon, or purchase goods on Amazon or Aliexpress. We also use affiliate links in articles to earn commissions if you make a purchase after clicking on those links.